Immigrants from Northern Europe Wage/Income Gap

COMPARE

Immigrants from Northern Europe
Race
Ancestry
AfghanAfricanAlaska NativeAlaskan AthabascanAlbanianAleutAlsatianAmericanApacheArabArapahoArgentineanArmenianAssyrian/Chaldean/SyriacAustralianAustrianBahamianBangladeshiBarbadianBasqueBelgianBelizeanBermudanBhutaneseBlackfeetBolivianBrazilianBritishBritish West IndianBulgarianBurmeseCajunCambodianCanadianCape VerdeanCarpatho RusynCelticCentral AmericanCentral American IndianCherokeeCheyenneChickasawChileanChineseChippewaChoctawColombianColvilleComancheCosta RicanCreeCreekCroatianCrowCubanCypriotCzechCzechoslovakianDanishDelawareDominicanDutchDutch West IndianEastern EuropeanEcuadorianEgyptianEnglishEstonianEthiopianEuropeanFijianFilipinoFinnishFrenchFrench American IndianFrench CanadianGermanGerman RussianGhanaianGreekGuamanian/ChamorroGuatemalanGuyaneseHaitianHmongHonduranHopiHoumaHungarianIcelanderIndian (Asian)IndonesianInupiatIranianIraqiIrishIroquoisIsraeliItalianJamaicanJapaneseJordanianKenyanKiowaKoreanLaotianLatvianLebaneseLiberianLithuanianLumbeeLuxembourgerMacedonianMalaysianMalteseMarshalleseMenomineeMexicanMexican American IndianMongolianMoroccanNative HawaiianNavajoNepaleseNew ZealanderNicaraguanNigerianNorthern EuropeanNorwegianOkinawanOsageOttawaPaiutePakistaniPalestinianPanamanianParaguayanPennsylvania GermanPeruvianPimaPolishPortuguesePotawatomiPuebloPuerto RicanPuget Sound SalishRomanianRussianSalvadoranSamoanScandinavianScotch-IrishScottishSeminoleSenegaleseSerbianShoshoneSierra LeoneanSiouxSlavicSlovakSloveneSomaliSouth AfricanSouth AmericanSouth American IndianSoviet UnionSpaniardSpanishSpanish AmericanSpanish American IndianSri LankanSubsaharan AfricanSudaneseSwedishSwissSyrianTaiwaneseThaiTlingit-HaidaTohono O'OdhamTonganTrinidadian and TobagonianTsimshianTurkishU.S. Virgin IslanderUgandanUkrainianUruguayanUteVenezuelanVietnameseWelshWest IndianYakamaYaquiYugoslavianYumanYup'ikZimbabwean
Immigration
NonimmigrantsImmigrantsAfghanistanAfricaAlbaniaArgentinaArmeniaAsiaAustraliaAustriaBahamasBangladeshBarbadosBelarusBelgiumBelizeBoliviaBosnia and HerzegovinaBrazilBulgariaBurma/MyanmarCabo VerdeCambodiaCameroonCanadaCaribbeanCentral AmericaChileChinaColombiaCongoCosta RicaCroatiaCubaCzechoslovakiaDenmarkDominicaDominican RepublicEastern AfricaEastern AsiaEastern EuropeEcuadorEgyptEl SalvadorEnglandEritreaEthiopiaEuropeFijiFranceGermanyGhanaGreeceGrenadaGuatemalaGuyanaHaitiHondurasHong KongHungaryIndiaIndonesiaIranIraqIrelandIsraelItalyJamaicaJapanJordanKazakhstanKenyaKoreaKuwaitLaosLatin AmericaLatviaLebanonLiberiaLithuaniaMalaysiaMexicoMicronesiaMiddle AfricaMoldovaMoroccoNepalNetherlandsNicaraguaNigeriaNorth AmericaNorth MacedoniaNorthern AfricaNorthern EuropeNorwayOceaniaPakistanPanamaPeruPhilippinesPolandPortugalRomaniaRussiaSaudi ArabiaScotlandSenegalSerbiaSierra LeoneSingaporeSomaliaSouth AfricaSouth AmericaSouth Central AsiaSouth Eastern AsiaSouthern EuropeSpainSri LankaSt. Vincent and the GrenadinesSudanSwedenSwitzerlandSyriaTaiwanThailandTrinidad and TobagoTurkeyUgandaUkraineUruguayUzbekistanVenezuelaVietnamWest IndiesWestern AfricaWestern AsiaWestern EuropeYemenZaireZimbabweAzores
Select to Compare
Race
Ancestry
AfghanAfricanAlaska NativeAlaskan AthabascanAlbanianAleutAlsatianAmericanApacheArabArapahoArgentineanArmenianAssyrian/Chaldean/SyriacAustralianAustrianBahamianBangladeshiBarbadianBasqueBelgianBelizeanBermudanBhutaneseBlackfeetBolivianBrazilianBritishBritish West IndianBulgarianBurmeseCajunCambodianCanadianCape VerdeanCarpatho RusynCelticCentral AmericanCentral American IndianCherokeeCheyenneChickasawChileanChineseChippewaChoctawColombianColvilleComancheCosta RicanCreeCreekCroatianCrowCubanCypriotCzechCzechoslovakianDanishDelawareDominicanDutchDutch West IndianEastern EuropeanEcuadorianEgyptianEnglishEstonianEthiopianEuropeanFijianFilipinoFinnishFrenchFrench American IndianFrench CanadianGermanGerman RussianGhanaianGreekGuamanian/ChamorroGuatemalanGuyaneseHaitianHmongHonduranHopiHoumaHungarianIcelanderIndian (Asian)IndonesianInupiatIranianIraqiIrishIroquoisIsraeliItalianJamaicanJapaneseJordanianKenyanKiowaKoreanLaotianLatvianLebaneseLiberianLithuanianLumbeeLuxembourgerMacedonianMalaysianMalteseMarshalleseMenomineeMexicanMexican American IndianMongolianMoroccanNative HawaiianNavajoNepaleseNew ZealanderNicaraguanNigerianNorthern EuropeanNorwegianOkinawanOsageOttawaPaiutePakistaniPalestinianPanamanianParaguayanPennsylvania GermanPeruvianPimaPolishPortuguesePotawatomiPuebloPuerto RicanPuget Sound SalishRomanianRussianSalvadoranSamoanScandinavianScotch-IrishScottishSeminoleSenegaleseSerbianShoshoneSierra LeoneanSiouxSlavicSlovakSloveneSomaliSouth AfricanSouth AmericanSouth American IndianSoviet UnionSpaniardSpanishSpanish AmericanSpanish American IndianSri LankanSubsaharan AfricanSudaneseSwedishSwissSyrianTaiwaneseThaiTlingit-HaidaTohono O'OdhamTonganTrinidadian and TobagonianTsimshianTurkishU.S. Virgin IslanderUgandanUkrainianUruguayanUteVenezuelanVietnameseWelshWest IndianYakamaYaquiYugoslavianYumanYup'ikZimbabwean
Immigration
NonimmigrantsImmigrantsAfghanistanAfricaAlbaniaArgentinaArmeniaAsiaAustraliaAustriaBahamasBangladeshBarbadosBelarusBelgiumBelizeBoliviaBosnia and HerzegovinaBrazilBulgariaBurma/MyanmarCabo VerdeCambodiaCameroonCanadaCaribbeanCentral AmericaChileChinaColombiaCongoCosta RicaCroatiaCubaCzechoslovakiaDenmarkDominicaDominican RepublicEastern AfricaEastern AsiaEastern EuropeEcuadorEgyptEl SalvadorEnglandEritreaEthiopiaEuropeFijiFranceGermanyGhanaGreeceGrenadaGuatemalaGuyanaHaitiHondurasHong KongHungaryIndiaIndonesiaIranIraqIrelandIsraelItalyJamaicaJapanJordanKazakhstanKenyaKoreaKuwaitLaosLatin AmericaLatviaLebanonLiberiaLithuaniaMalaysiaMexicoMicronesiaMiddle AfricaMoldovaMoroccoNepalNetherlandsNicaraguaNigeriaNorth AmericaNorth MacedoniaNorthern AfricaNorwayOceaniaPakistanPanamaPeruPhilippinesPolandPortugalRomaniaRussiaSaudi ArabiaScotlandSenegalSerbiaSierra LeoneSingaporeSomaliaSouth AfricaSouth AmericaSouth Central AsiaSouth Eastern AsiaSouthern EuropeSpainSri LankaSt. Vincent and the GrenadinesSudanSwedenSwitzerlandSyriaTaiwanThailandTrinidad and TobagoTurkeyUgandaUkraineUruguayUzbekistanVenezuelaVietnamWest IndiesWestern AfricaWestern AsiaWestern EuropeYemenZaireZimbabweAzores
Wage/Income Gap
Income
Poverty
Unemployment
Labor Participation
Family Structure
Vehicle Availability
Education Level
Disability

Immigrants from Northern Europe Wage/Income Gap
Tragic

28.5%
WAGE/INCOME GAP
0.2/ 100
METRIC RATING
300th/ 347
METRIC RANK

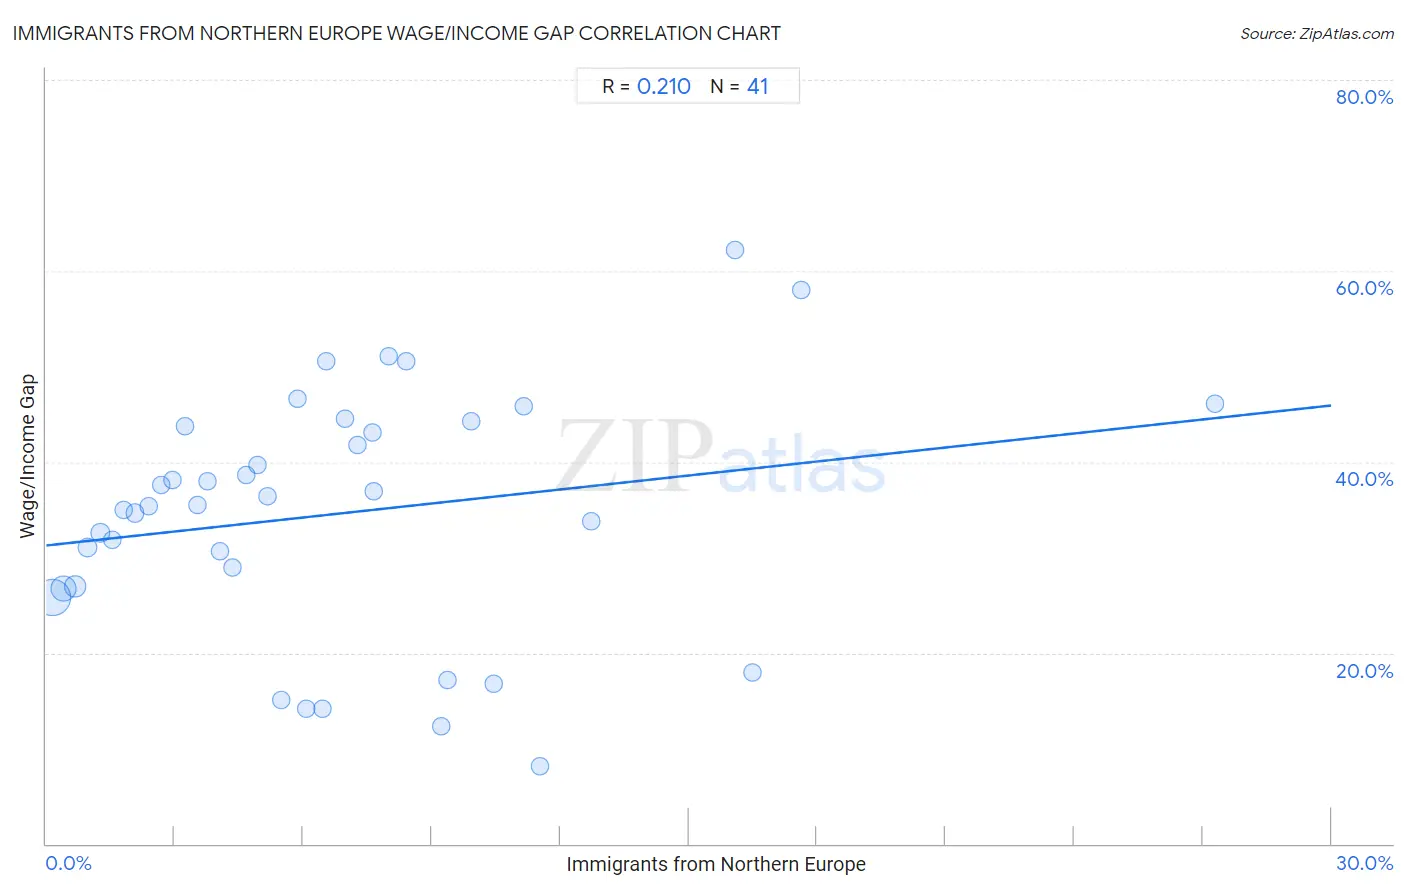
Immigrants from Northern Europe Wage/Income Gap Correlation Chart

The statistical analysis conducted on geographies consisting of 476,427,799 people shows a weak positive correlation between the proportion of Immigrants from Northern Europe and wage/income gap percentage in the United States with a correlation coefficient (R) of 0.210 and weighted average of 28.5%. On average, for every 1% (one percent) increase in Immigrants from Northern Europe within a typical geography, there is an increase of 0.49% in wage/income gap percentage.
Immigrants from Northern Europe Wage/Income Gap
It is essential to understand that the correlation between the percentage of Immigrants from Northern Europe and wage/income gap percentage does not imply a direct cause-and-effect relationship. It remains uncertain whether the presence of Immigrants from Northern Europe influences an upward or downward trend in the level of wage/income gap percentage within an area, or if Immigrants from Northern Europe simply ended up residing in those areas with higher or lower levels of wage/income gap percentage due to other factors.

Demographics Similar to Immigrants from Northern Europe by Wage/Income Gap

In terms of wage/income gap, the demographic groups most similar to Immigrants from Northern Europe are Immigrants from Canada (28.5%, a difference of 0.040%), Scotch-Irish (28.5%, a difference of 0.070%), Irish (28.5%, a difference of 0.080%), Immigrants from North Macedonia (28.4%, a difference of 0.12%), and Austrian (28.4%, a difference of 0.16%).
DemographicsRating | RankWage/Income Gap
Immigrants from Israel
0.3
/100
|
#293
Tragic
28.2%
Greeks
0.3
/100
|
#294
Tragic
28.2%
Slovenes
0.3
/100
|
#295
Tragic
28.3%
Northern Europeans
0.3
/100
|
#296
Tragic
28.3%
Immigrants from North America
0.2
/100
|
#297
Tragic
28.4%
Austrians
0.2
/100
|
#298
Tragic
28.4%
Immigrants from North Macedonia
0.2
/100
|
#299
Tragic
28.4%
Immigrants from Northern Europe
0.2
/100
|
#300
Tragic
28.5%
Immigrants from Canada
0.2
/100
|
#301
Tragic
28.5%
Scotch-Irish
0.2
/100
|
#302
Tragic
28.5%
Irish
0.2
/100
|
#303
Tragic
28.5%
Immigrants from Netherlands
0.2
/100
|
#304
Tragic
28.5%
Immigrants from South Africa
0.1
/100
|
#305
Tragic
28.5%
Whites/Caucasians
0.1
/100
|
#306
Tragic
28.5%
Immigrants from Denmark
0.1
/100
|
#307
Tragic
28.5%

Immigrants from Northern Europe Wage/Income Gap Correlation Summary

MeasurementImmigrants from Northern Europe DataWage/Income Gap Data
Minimum0.13%8.1%
Maximum27.3%62.1%
Range27.1%54.0%
Mean6.8%34.6%
Median5.9%35.4%
Interquartile 25% (IQ1)2.8%26.8%
Interquartile 75% (IQ3)9.3%44.0%
Interquartile Range (IQR)6.5%17.2%
Standard Deviation (Sample)5.5%12.8%
Standard Deviation (Population)5.4%12.6%

Correlation Details

Immigrants from Northern Europe PercentileSample SizeWage/Income Gap
[
0.0%
-
0.5%
]
0.13%
272,084,72925.8%
[
0.0%
-
0.5%
]
0.40%
115,495,33926.7%
[
0.5%
-
1.0%
]
0.66%
50,556,68426.9%
[
0.5%
-
1.0%
]
0.97%
18,322,88931.0%
[
1.0%
-
1.5%
]
1.26%
8,667,60232.6%
[
1.5%
-
2.0%
]
1.55%
5,064,85031.8%
[
1.5%
-
2.0%
]
1.81%
2,173,17935.0%
[
2.0%
-
2.5%
]
2.08%
1,564,39334.6%
[
2.0%
-
2.5%
]
2.38%
749,13135.3%
[
2.5%
-
3.0%
]
2.68%
468,89437.6%
[
2.5%
-
3.0%
]
2.96%
294,73738.0%
[
3.0%
-
3.5%
]
3.23%
252,79943.7%
[
3.5%
-
4.0%
]
3.52%
197,75435.4%
[
3.5%
-
4.0%
]
3.77%
169,78638.0%
[
4.0%
-
4.5%
]
4.07%
83,69230.6%
[
4.0%
-
4.5%
]
4.33%
68,94829.0%
[
4.5%
-
5.0%
]
4.67%
49,10138.6%
[
4.5%
-
5.0%
]
4.93%
25,74339.6%
[
5.0%
-
5.5%
]
5.16%
21,18436.4%
[
5.0%
-
5.5%
]
5.49%
42,93515.0%
[
5.5%
-
6.0%
]
5.88%
23,35346.6%
[
6.0%
-
6.5%
]
6.06%
72614.2%
[
6.0%
-
6.5%
]
6.45%
5,78514.2%
[
6.5%
-
7.0%
]
6.53%
15,75050.5%
[
6.5%
-
7.0%
]
6.98%
9,49444.5%
[
7.0%
-
7.5%
]
7.28%
5,16641.7%
[
7.5%
-
8.0%
]
7.60%
43443.0%
[
7.5%
-
8.0%
]
7.66%
90136.9%
[
8.0%
-
8.5%
]
8.01%
4,18251.1%
[
8.0%
-
8.5%
]
8.41%
34550.5%
[
9.0%
-
9.5%
]
9.23%
1,02912.3%
[
9.0%
-
9.5%
]
9.38%
56517.1%
[
9.5%
-
10.0%
]
9.92%
59544.3%
[
10.0%
-
10.5%
]
10.45%
77516.7%
[
11.0%
-
11.5%
]
11.14%
2,54045.8%
[
11.5%
-
12.0%
]
11.54%
1308.1%
[
12.5%
-
13.0%
]
12.71%
29133.8%
[
16.0%
-
16.5%
]
16.07%
36162.1%
[
16.0%
-
16.5%
]
16.50%
49117.9%
[
17.5%
-
18.0%
]
17.61%
35258.0%
[
27.0%
-
27.5%
]
27.27%
16546.1%