Immigrants from Northern Europe Married-couple Households
COMPARE
Immigrants from Northern Europe
Select to Compare
Married-couple Households
Immigrants from Northern Europe Married-couple Households
48.6%
MARRIED-COUPLE HOUSEHOLDS
99.3/ 100
METRIC RATING
56th/ 347
METRIC RANK
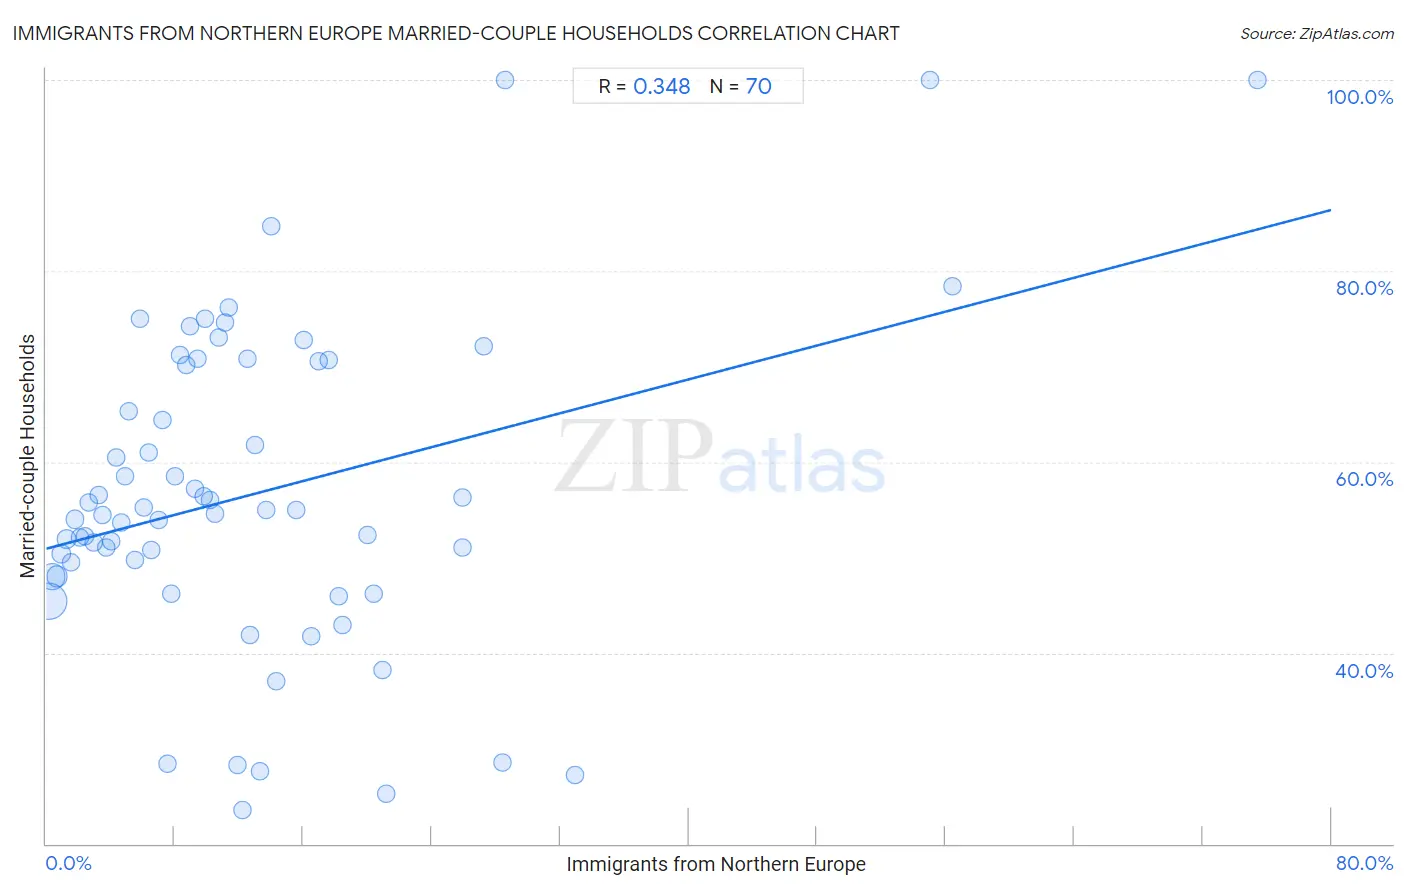
Immigrants from Northern Europe Married-couple Households Correlation Chart
The statistical analysis conducted on geographies consisting of 476,937,950 people shows a mild positive correlation between the proportion of Immigrants from Northern Europe and percentage of married-couple family households in the United States with a correlation coefficient (R) of 0.348 and weighted average of 48.6%. On average, for every 1% (one percent) increase in Immigrants from Northern Europe within a typical geography, there is an increase of 0.44% in percentage of married-couple family households.
It is essential to understand that the correlation between the percentage of Immigrants from Northern Europe and percentage of married-couple family households does not imply a direct cause-and-effect relationship. It remains uncertain whether the presence of Immigrants from Northern Europe influences an upward or downward trend in the level of percentage of married-couple family households within an area, or if Immigrants from Northern Europe simply ended up residing in those areas with higher or lower levels of percentage of married-couple family households due to other factors.
Demographics Similar to Immigrants from Northern Europe by Married-couple Households
In terms of married-couple households, the demographic groups most similar to Immigrants from Northern Europe are Austrian (48.6%, a difference of 0.0%), White/Caucasian (48.6%, a difference of 0.010%), Immigrants from Lithuania (48.6%, a difference of 0.010%), Irish (48.6%, a difference of 0.070%), and Polish (48.5%, a difference of 0.090%).
| Demographics | Rating | Rank | Married-couple Households |
| Immigrants from Sri Lanka | 99.4 /100 | #49 | Exceptional 48.7% |
| Samoans | 99.4 /100 | #50 | Exceptional 48.7% |
| Eastern Europeans | 99.3 /100 | #51 | Exceptional 48.6% |
| Irish | 99.3 /100 | #52 | Exceptional 48.6% |
| Whites/Caucasians | 99.3 /100 | #53 | Exceptional 48.6% |
| Immigrants from Lithuania | 99.3 /100 | #54 | Exceptional 48.6% |
| Austrians | 99.3 /100 | #55 | Exceptional 48.6% |
| Immigrants from Northern Europe | 99.3 /100 | #56 | Exceptional 48.6% |
| Poles | 99.2 /100 | #57 | Exceptional 48.5% |
| Immigrants from Indonesia | 99.2 /100 | #58 | Exceptional 48.5% |
| Czechoslovakians | 99.2 /100 | #59 | Exceptional 48.5% |
| Croatians | 99.1 /100 | #60 | Exceptional 48.5% |
| Bulgarians | 99.1 /100 | #61 | Exceptional 48.5% |
| Luxembourgers | 99.1 /100 | #62 | Exceptional 48.5% |
| Basques | 99.0 /100 | #63 | Exceptional 48.4% |
Immigrants from Northern Europe Married-couple Households Correlation Summary
| Measurement | Immigrants from Northern Europe Data | Married-couple Households Data |
| Minimum | 0.13% | 23.5% |
| Maximum | 75.4% | 100.0% |
| Range | 75.3% | 76.5% |
| Mean | 13.0% | 56.7% |
| Median | 9.9% | 54.7% |
| Interquartile 25% (IQ1) | 4.9% | 48.0% |
| Interquartile 75% (IQ3) | 16.5% | 70.5% |
| Interquartile Range (IQR) | 11.6% | 22.5% |
| Standard Deviation (Sample) | 13.1% | 16.7% |
| Standard Deviation (Population) | 13.0% | 16.6% |
Correlation Details
| Immigrants from Northern Europe Percentile | Sample Size | Married-couple Households |
[ 0.0% - 0.5% ] 0.13% | 272,078,645 | 45.5% |
[ 0.0% - 0.5% ] 0.40% | 115,555,932 | 48.0% |
[ 0.5% - 1.0% ] 0.66% | 50,624,846 | 48.0% |
[ 0.5% - 1.0% ] 0.97% | 18,398,051 | 50.4% |
[ 1.0% - 1.5% ] 1.26% | 8,714,796 | 51.9% |
[ 1.5% - 2.0% ] 1.55% | 5,116,722 | 49.5% |
[ 1.5% - 2.0% ] 1.81% | 2,217,395 | 54.0% |
[ 2.0% - 2.5% ] 2.08% | 1,589,130 | 52.1% |
[ 2.0% - 2.5% ] 2.38% | 760,282 | 52.1% |
[ 2.5% - 3.0% ] 2.68% | 491,411 | 55.8% |
[ 2.5% - 3.0% ] 2.96% | 304,371 | 51.6% |
[ 3.0% - 3.5% ] 3.23% | 264,268 | 56.5% |
[ 3.5% - 4.0% ] 3.52% | 207,170 | 54.4% |
[ 3.5% - 4.0% ] 3.77% | 188,861 | 51.0% |
[ 4.0% - 4.5% ] 4.08% | 94,352 | 51.6% |
[ 4.0% - 4.5% ] 4.34% | 76,025 | 60.4% |
[ 4.5% - 5.0% ] 4.67% | 55,708 | 53.6% |
[ 4.5% - 5.0% ] 4.93% | 26,500 | 58.5% |
[ 5.0% - 5.5% ] 5.15% | 24,427 | 65.3% |
[ 5.0% - 5.5% ] 5.49% | 47,206 | 49.7% |
[ 5.5% - 6.0% ] 5.87% | 24,981 | 75.0% |
[ 6.0% - 6.5% ] 6.07% | 2,406 | 55.2% |
[ 6.0% - 6.5% ] 6.41% | 7,287 | 61.0% |
[ 6.5% - 7.0% ] 6.55% | 18,291 | 50.8% |
[ 6.5% - 7.0% ] 6.97% | 12,287 | 54.0% |
[ 7.0% - 7.5% ] 7.27% | 6,066 | 64.4% |
[ 7.5% - 8.0% ] 7.53% | 3,083 | 28.4% |
[ 7.5% - 8.0% ] 7.76% | 2,462 | 46.2% |
[ 8.0% - 8.5% ] 8.02% | 4,636 | 58.6% |
[ 8.0% - 8.5% ] 8.33% | 876 | 71.2% |
[ 8.5% - 9.0% ] 8.68% | 864 | 70.1% |
[ 8.5% - 9.0% ] 8.97% | 1,483 | 74.2% |
[ 9.0% - 9.5% ] 9.24% | 1,180 | 57.2% |
[ 9.0% - 9.5% ] 9.41% | 999 | 70.8% |
[ 9.5% - 10.0% ] 9.82% | 550 | 56.4% |
[ 9.5% - 10.0% ] 9.92% | 595 | 75.0% |
[ 10.0% - 10.5% ] 10.23% | 567 | 56.1% |
[ 10.0% - 10.5% ] 10.49% | 991 | 54.6% |
[ 10.5% - 11.0% ] 10.76% | 1,264 | 73.0% |
[ 11.0% - 11.5% ] 11.14% | 2,540 | 74.6% |
[ 11.0% - 11.5% ] 11.40% | 623 | 76.2% |
[ 11.5% - 12.0% ] 11.90% | 84 | 28.2% |
[ 12.0% - 12.5% ] 12.22% | 180 | 23.5% |
[ 12.0% - 12.5% ] 12.50% | 40 | 70.8% |
[ 12.5% - 13.0% ] 12.72% | 747 | 41.8% |
[ 13.0% - 13.5% ] 13.03% | 238 | 61.7% |
[ 13.0% - 13.5% ] 13.33% | 60 | 27.6% |
[ 13.5% - 14.0% ] 13.66% | 366 | 54.9% |
[ 14.0% - 14.5% ] 14.02% | 1,013 | 84.7% |
[ 14.0% - 14.5% ] 14.35% | 230 | 37.0% |
[ 15.5% - 16.0% ] 15.53% | 953 | 54.9% |
[ 16.0% - 16.5% ] 16.04% | 636 | 72.8% |
[ 16.0% - 16.5% ] 16.50% | 491 | 41.7% |
[ 16.5% - 17.0% ] 16.98% | 106 | 70.5% |
[ 17.5% - 18.0% ] 17.61% | 352 | 70.6% |
[ 18.0% - 18.5% ] 18.18% | 55 | 45.9% |
[ 18.0% - 18.5% ] 18.42% | 76 | 42.9% |
[ 20.0% - 20.5% ] 20.00% | 30 | 52.4% |
[ 20.0% - 20.5% ] 20.35% | 285 | 46.2% |
[ 20.5% - 21.0% ] 20.90% | 244 | 38.1% |
[ 21.0% - 21.5% ] 21.19% | 453 | 25.2% |
[ 25.5% - 26.0% ] 25.93% | 54 | 56.2% |
[ 25.5% - 26.0% ] 25.95% | 185 | 51.0% |
[ 27.0% - 27.5% ] 27.27% | 165 | 72.2% |
[ 28.0% - 28.5% ] 28.41% | 88 | 28.6% |
[ 28.5% - 29.0% ] 28.57% | 21 | 100.0% |
[ 32.5% - 33.0% ] 32.95% | 88 | 27.1% |
[ 55.0% - 55.5% ] 55.00% | 20 | 100.0% |
[ 56.0% - 56.5% ] 56.39% | 321 | 78.4% |
[ 75.0% - 75.5% ] 75.42% | 240 | 100.0% |