Immigrants from Australia Married-couple Households
COMPARE
Immigrants from Australia
Select to Compare
Married-couple Households
Immigrants from Australia Married-couple Households
46.5%
MARRIED-COUPLE HOUSEHOLDS
54.6/ 100
METRIC RATING
172nd/ 347
METRIC RANK
Immigrants from Australia Married-couple Households Correlation Chart
The statistical analysis conducted on geographies consisting of 227,144,828 people shows a poor negative correlation between the proportion of Immigrants from Australia and percentage of married-couple family households in the United States with a correlation coefficient (R) of -0.167 and weighted average of 46.5%. On average, for every 1% (one percent) increase in Immigrants from Australia within a typical geography, there is a decrease of 0.72% in percentage of married-couple family households.
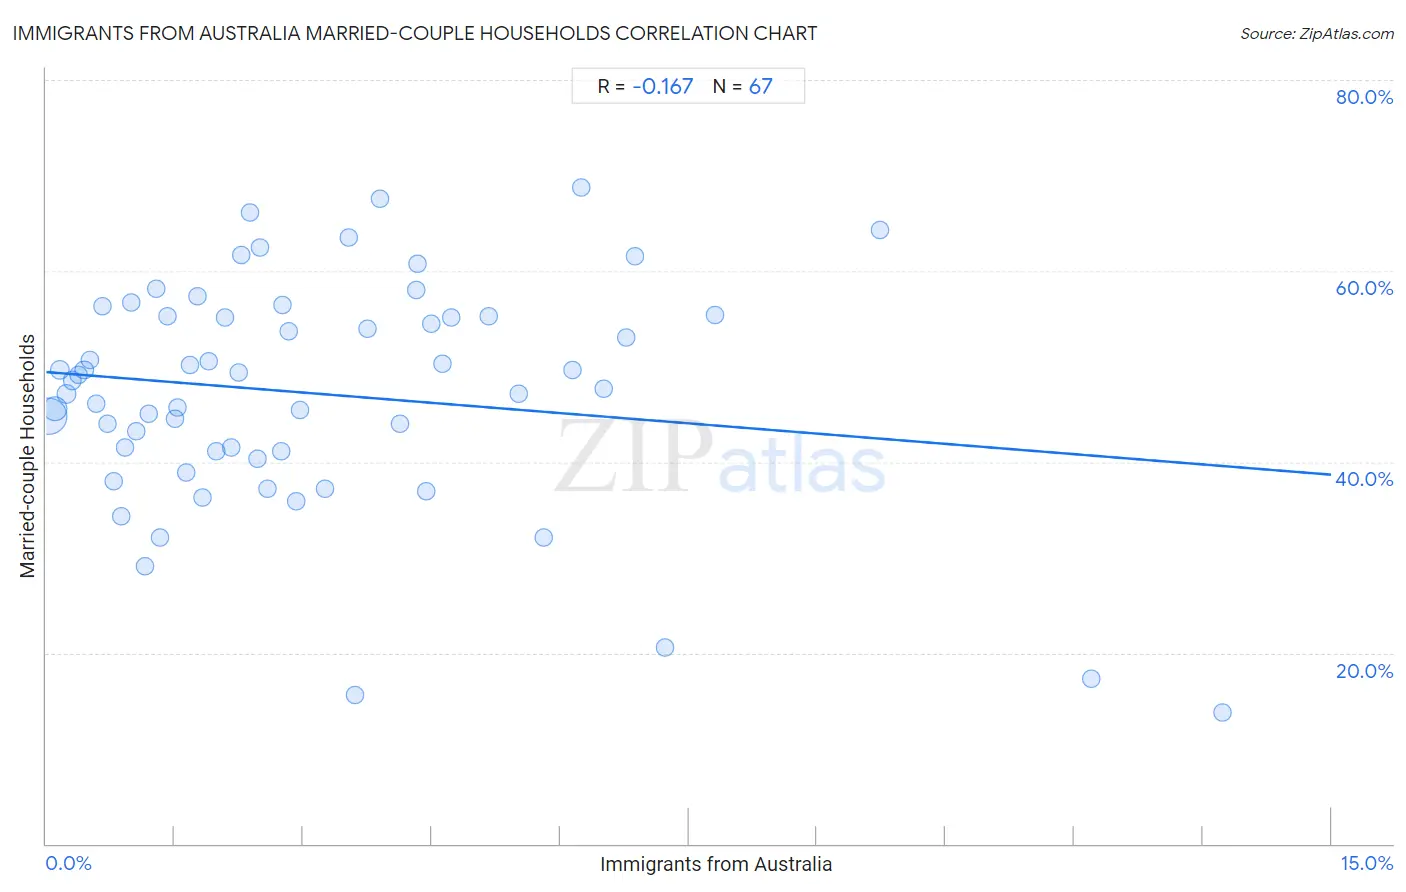
It is essential to understand that the correlation between the percentage of Immigrants from Australia and percentage of married-couple family households does not imply a direct cause-and-effect relationship. It remains uncertain whether the presence of Immigrants from Australia influences an upward or downward trend in the level of percentage of married-couple family households within an area, or if Immigrants from Australia simply ended up residing in those areas with higher or lower levels of percentage of married-couple family households due to other factors.
Demographics Similar to Immigrants from Australia by Married-couple Households
In terms of married-couple households, the demographic groups most similar to Immigrants from Australia are Immigrants from Chile (46.5%, a difference of 0.040%), Immigrants from Norway (46.5%, a difference of 0.10%), South American (46.6%, a difference of 0.13%), Immigrants from Mexico (46.4%, a difference of 0.17%), and Spanish American Indian (46.6%, a difference of 0.18%).
| Demographics | Rating | Rank | Married-couple Households |
| Immigrants from Southern Europe | 69.9 /100 | #165 | Good 46.8% |
| Cherokee | 65.7 /100 | #166 | Good 46.7% |
| Immigrants from Croatia | 64.2 /100 | #167 | Good 46.7% |
| Israelis | 62.3 /100 | #168 | Good 46.7% |
| Spanish American Indians | 59.4 /100 | #169 | Average 46.6% |
| South Americans | 58.0 /100 | #170 | Average 46.6% |
| Immigrants from Chile | 55.7 /100 | #171 | Average 46.5% |
| Immigrants from Australia | 54.6 /100 | #172 | Average 46.5% |
| Immigrants from Norway | 52.0 /100 | #173 | Average 46.5% |
| Immigrants from Mexico | 50.0 /100 | #174 | Average 46.4% |
| Immigrants from Colombia | 46.1 /100 | #175 | Average 46.4% |
| Cajuns | 45.2 /100 | #176 | Average 46.4% |
| Immigrants | 43.8 /100 | #177 | Average 46.3% |
| Immigrants from Costa Rica | 43.4 /100 | #178 | Average 46.3% |
| Immigrants from Zimbabwe | 43.0 /100 | #179 | Average 46.3% |
Immigrants from Australia Married-couple Households Correlation Summary
| Measurement | Immigrants from Australia Data | Married-couple Households Data |
| Minimum | 0.030% | 13.7% |
| Maximum | 13.7% | 68.8% |
| Range | 13.7% | 55.0% |
| Mean | 3.1% | 47.2% |
| Median | 2.4% | 48.5% |
| Interquartile 25% (IQ1) | 1.1% | 41.1% |
| Interquartile 75% (IQ3) | 4.4% | 55.3% |
| Interquartile Range (IQR) | 3.3% | 14.1% |
| Standard Deviation (Sample) | 2.8% | 12.0% |
| Standard Deviation (Population) | 2.8% | 11.9% |
Correlation Details
| Immigrants from Australia Percentile | Sample Size | Married-couple Households |
[ 0.0% - 0.5% ] 0.030% | 148,063,259 | 44.8% |
[ 0.0% - 0.5% ] 0.099% | 50,271,938 | 45.6% |
[ 0.0% - 0.5% ] 0.16% | 12,172,988 | 49.6% |
[ 0.0% - 0.5% ] 0.24% | 6,397,343 | 47.1% |
[ 0.0% - 0.5% ] 0.31% | 2,829,891 | 48.5% |
[ 0.0% - 0.5% ] 0.37% | 2,571,340 | 49.1% |
[ 0.0% - 0.5% ] 0.44% | 1,333,564 | 49.7% |
[ 0.5% - 1.0% ] 0.51% | 1,080,603 | 50.6% |
[ 0.5% - 1.0% ] 0.58% | 790,062 | 46.1% |
[ 0.5% - 1.0% ] 0.66% | 361,433 | 56.3% |
[ 0.5% - 1.0% ] 0.72% | 233,921 | 44.0% |
[ 0.5% - 1.0% ] 0.78% | 279,099 | 37.9% |
[ 0.5% - 1.0% ] 0.87% | 99,023 | 34.4% |
[ 0.5% - 1.0% ] 0.92% | 105,890 | 41.4% |
[ 0.5% - 1.0% ] 0.99% | 78,308 | 56.7% |
[ 1.0% - 1.5% ] 1.05% | 17,671 | 43.2% |
[ 1.0% - 1.5% ] 1.15% | 90,145 | 29.0% |
[ 1.0% - 1.5% ] 1.20% | 87,490 | 45.1% |
[ 1.0% - 1.5% ] 1.28% | 38,149 | 58.1% |
[ 1.0% - 1.5% ] 1.32% | 43,537 | 32.1% |
[ 1.0% - 1.5% ] 1.41% | 16,222 | 55.3% |
[ 1.5% - 2.0% ] 1.50% | 35,234 | 44.5% |
[ 1.5% - 2.0% ] 1.54% | 2,209 | 45.7% |
[ 1.5% - 2.0% ] 1.63% | 7,851 | 38.9% |
[ 1.5% - 2.0% ] 1.67% | 6,993 | 50.1% |
[ 1.5% - 2.0% ] 1.76% | 7,662 | 57.3% |
[ 1.5% - 2.0% ] 1.82% | 29,517 | 36.3% |
[ 1.5% - 2.0% ] 1.89% | 10,661 | 50.6% |
[ 1.5% - 2.0% ] 1.99% | 2,668 | 41.2% |
[ 2.0% - 2.5% ] 2.08% | 528 | 55.2% |
[ 2.0% - 2.5% ] 2.16% | 3,511 | 41.5% |
[ 2.0% - 2.5% ] 2.25% | 5,824 | 49.4% |
[ 2.0% - 2.5% ] 2.28% | 2,191 | 61.7% |
[ 2.0% - 2.5% ] 2.37% | 12,555 | 66.2% |
[ 2.0% - 2.5% ] 2.46% | 5,478 | 40.4% |
[ 2.0% - 2.5% ] 2.50% | 40 | 62.5% |
[ 2.5% - 3.0% ] 2.58% | 3,842 | 37.2% |
[ 2.5% - 3.0% ] 2.74% | 14,578 | 41.1% |
[ 2.5% - 3.0% ] 2.76% | 5,807 | 56.4% |
[ 2.5% - 3.0% ] 2.83% | 2,051 | 53.6% |
[ 2.5% - 3.0% ] 2.92% | 10,274 | 35.9% |
[ 2.5% - 3.0% ] 2.97% | 1,381 | 45.4% |
[ 3.0% - 3.5% ] 3.26% | 215 | 37.2% |
[ 3.5% - 4.0% ] 3.54% | 396 | 63.5% |
[ 3.5% - 4.0% ] 3.61% | 416 | 15.6% |
[ 3.5% - 4.0% ] 3.75% | 774 | 53.9% |
[ 3.5% - 4.0% ] 3.89% | 180 | 67.5% |
[ 4.0% - 4.5% ] 4.12% | 97 | 44.0% |
[ 4.0% - 4.5% ] 4.32% | 301 | 58.0% |
[ 4.0% - 4.5% ] 4.33% | 300 | 60.8% |
[ 4.0% - 4.5% ] 4.43% | 158 | 37.0% |
[ 4.0% - 4.5% ] 4.50% | 867 | 54.5% |
[ 4.5% - 5.0% ] 4.62% | 1,537 | 50.2% |
[ 4.5% - 5.0% ] 4.73% | 1,840 | 55.2% |
[ 5.0% - 5.5% ] 5.16% | 581 | 55.2% |
[ 5.5% - 6.0% ] 5.52% | 326 | 47.2% |
[ 5.5% - 6.0% ] 5.81% | 155 | 32.1% |
[ 6.0% - 6.5% ] 6.14% | 277 | 49.6% |
[ 6.0% - 6.5% ] 6.25% | 32 | 68.8% |
[ 6.5% - 7.0% ] 6.51% | 614 | 47.7% |
[ 6.5% - 7.0% ] 6.77% | 133 | 53.1% |
[ 6.5% - 7.0% ] 6.88% | 800 | 61.5% |
[ 7.0% - 7.5% ] 7.23% | 83 | 20.5% |
[ 7.5% - 8.0% ] 7.80% | 1,307 | 55.4% |
[ 9.5% - 10.0% ] 9.73% | 565 | 64.3% |
[ 12.0% - 12.5% ] 12.20% | 41 | 17.2% |
[ 13.5% - 14.0% ] 13.73% | 102 | 13.7% |