Immigrants from Australia GED/Equivalency
COMPARE
Immigrants from Australia
Select to Compare
GED/Equivalency
Immigrants from Australia GED/Equivalency
88.6%
GED/EQUIVALENCY
99.8/ 100
METRIC RATING
26th/ 347
METRIC RANK
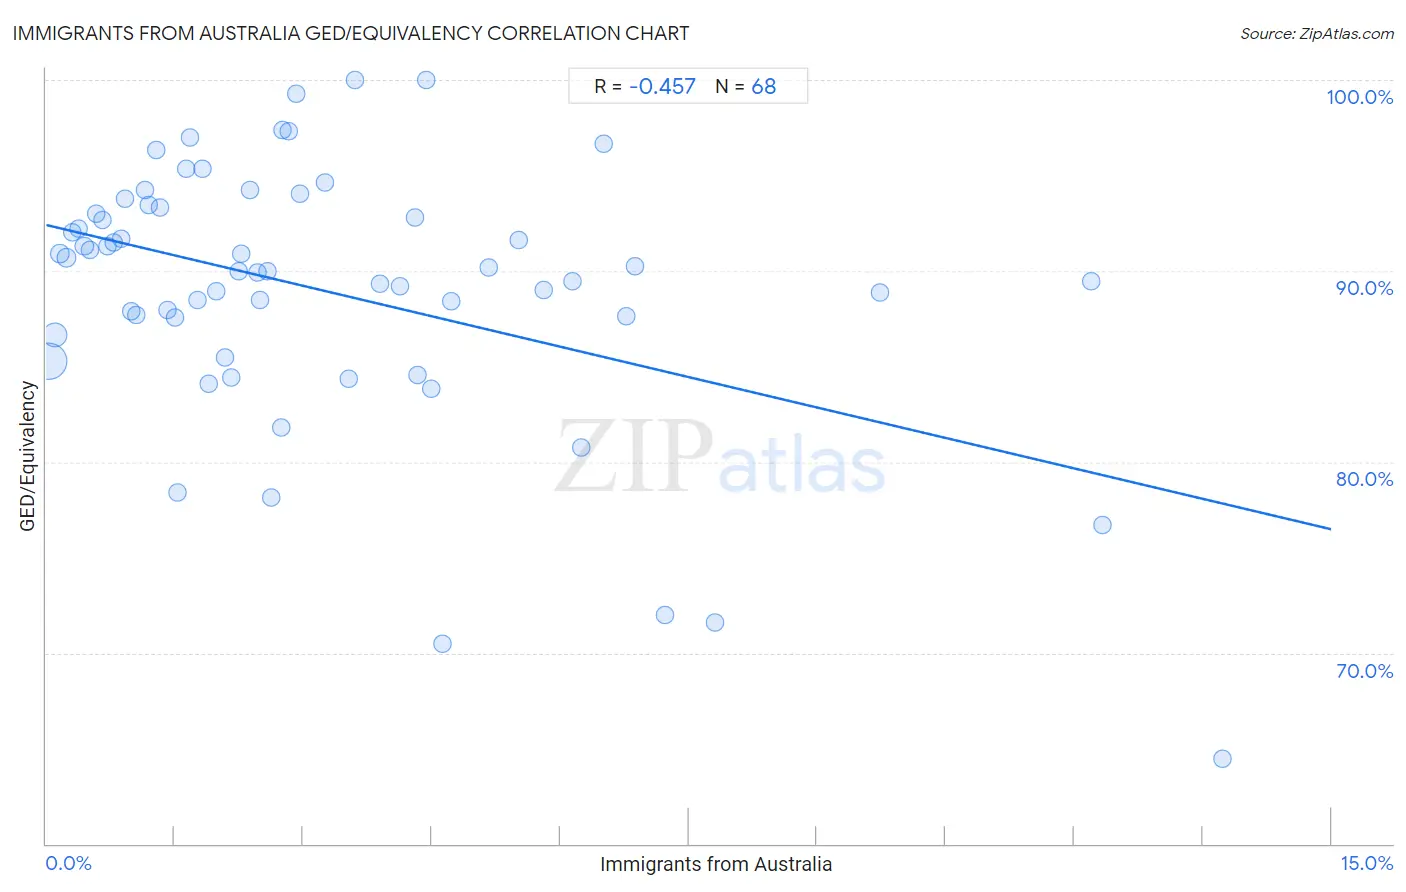
Immigrants from Australia GED/Equivalency Correlation Chart
The statistical analysis conducted on geographies consisting of 227,202,828 people shows a moderate negative correlation between the proportion of Immigrants from Australia and percentage of population with at least ged/equivalency education in the United States with a correlation coefficient (R) of -0.457 and weighted average of 88.6%. On average, for every 1% (one percent) increase in Immigrants from Australia within a typical geography, there is a decrease of 1.1% in percentage of population with at least ged/equivalency education.
It is essential to understand that the correlation between the percentage of Immigrants from Australia and percentage of population with at least ged/equivalency education does not imply a direct cause-and-effect relationship. It remains uncertain whether the presence of Immigrants from Australia influences an upward or downward trend in the level of percentage of population with at least ged/equivalency education within an area, or if Immigrants from Australia simply ended up residing in those areas with higher or lower levels of percentage of population with at least ged/equivalency education due to other factors.
Demographics Similar to Immigrants from Australia by GED/Equivalency
In terms of ged/equivalency, the demographic groups most similar to Immigrants from Australia are Slovak (88.6%, a difference of 0.0%), Estonian (88.6%, a difference of 0.0%), Russian (88.6%, a difference of 0.010%), Immigrants from Ireland (88.6%, a difference of 0.020%), and Luxembourger (88.6%, a difference of 0.030%).
| Demographics | Rating | Rank | GED/Equivalency |
| Swedes | 99.9 /100 | #19 | Exceptional 88.8% |
| Maltese | 99.9 /100 | #20 | Exceptional 88.6% |
| Luxembourgers | 99.8 /100 | #21 | Exceptional 88.6% |
| Immigrants from Ireland | 99.8 /100 | #22 | Exceptional 88.6% |
| Russians | 99.8 /100 | #23 | Exceptional 88.6% |
| Slovaks | 99.8 /100 | #24 | Exceptional 88.6% |
| Estonians | 99.8 /100 | #25 | Exceptional 88.6% |
| Immigrants from Australia | 99.8 /100 | #26 | Exceptional 88.6% |
| Immigrants from Lithuania | 99.8 /100 | #27 | Exceptional 88.6% |
| Immigrants from Northern Europe | 99.8 /100 | #28 | Exceptional 88.5% |
| Poles | 99.8 /100 | #29 | Exceptional 88.5% |
| Turks | 99.8 /100 | #30 | Exceptional 88.5% |
| Bhutanese | 99.8 /100 | #31 | Exceptional 88.4% |
| Danes | 99.8 /100 | #32 | Exceptional 88.4% |
| Immigrants from Sweden | 99.7 /100 | #33 | Exceptional 88.4% |
Immigrants from Australia GED/Equivalency Correlation Summary
| Measurement | Immigrants from Australia Data | GED/Equivalency Data |
| Minimum | 0.030% | 64.5% |
| Maximum | 13.7% | 100.0% |
| Range | 13.7% | 35.5% |
| Mean | 3.3% | 88.9% |
| Median | 2.4% | 90.0% |
| Interquartile 25% (IQ1) | 1.2% | 87.1% |
| Interquartile 75% (IQ3) | 4.5% | 93.2% |
| Interquartile Range (IQR) | 3.3% | 6.1% |
| Standard Deviation (Sample) | 3.0% | 6.9% |
| Standard Deviation (Population) | 3.0% | 6.9% |
Correlation Details
| Immigrants from Australia Percentile | Sample Size | GED/Equivalency |
[ 0.0% - 0.5% ] 0.030% | 148,063,259 | 85.3% |
[ 0.0% - 0.5% ] 0.099% | 50,290,384 | 86.7% |
[ 0.0% - 0.5% ] 0.16% | 12,181,462 | 90.9% |
[ 0.0% - 0.5% ] 0.24% | 6,408,038 | 90.7% |
[ 0.0% - 0.5% ] 0.31% | 2,832,486 | 92.0% |
[ 0.0% - 0.5% ] 0.37% | 2,571,340 | 92.2% |
[ 0.0% - 0.5% ] 0.44% | 1,333,564 | 91.3% |
[ 0.5% - 1.0% ] 0.51% | 1,081,219 | 91.1% |
[ 0.5% - 1.0% ] 0.58% | 797,150 | 93.0% |
[ 0.5% - 1.0% ] 0.66% | 361,433 | 92.7% |
[ 0.5% - 1.0% ] 0.72% | 233,921 | 91.3% |
[ 0.5% - 1.0% ] 0.78% | 281,054 | 91.5% |
[ 0.5% - 1.0% ] 0.87% | 99,023 | 91.7% |
[ 0.5% - 1.0% ] 0.92% | 105,890 | 93.8% |
[ 0.5% - 1.0% ] 0.99% | 78,810 | 87.9% |
[ 1.0% - 1.5% ] 1.05% | 17,671 | 87.7% |
[ 1.0% - 1.5% ] 1.15% | 90,145 | 94.3% |
[ 1.0% - 1.5% ] 1.20% | 90,189 | 93.5% |
[ 1.0% - 1.5% ] 1.28% | 38,149 | 96.4% |
[ 1.0% - 1.5% ] 1.32% | 43,537 | 93.3% |
[ 1.0% - 1.5% ] 1.41% | 15,789 | 87.9% |
[ 1.5% - 2.0% ] 1.50% | 37,588 | 87.5% |
[ 1.5% - 2.0% ] 1.54% | 2,209 | 78.4% |
[ 1.5% - 2.0% ] 1.63% | 7,851 | 95.4% |
[ 1.5% - 2.0% ] 1.67% | 6,993 | 97.0% |
[ 1.5% - 2.0% ] 1.76% | 7,662 | 88.5% |
[ 1.5% - 2.0% ] 1.82% | 29,517 | 95.3% |
[ 1.5% - 2.0% ] 1.89% | 10,661 | 84.1% |
[ 1.5% - 2.0% ] 1.99% | 2,668 | 88.9% |
[ 2.0% - 2.5% ] 2.08% | 528 | 85.5% |
[ 2.0% - 2.5% ] 2.16% | 3,511 | 84.4% |
[ 2.0% - 2.5% ] 2.25% | 5,824 | 90.0% |
[ 2.0% - 2.5% ] 2.28% | 2,191 | 90.9% |
[ 2.0% - 2.5% ] 2.37% | 12,555 | 94.2% |
[ 2.0% - 2.5% ] 2.46% | 5,478 | 89.9% |
[ 2.0% - 2.5% ] 2.50% | 40 | 88.5% |
[ 2.5% - 3.0% ] 2.58% | 3,842 | 90.0% |
[ 2.5% - 3.0% ] 2.63% | 266 | 78.2% |
[ 2.5% - 3.0% ] 2.74% | 14,578 | 81.8% |
[ 2.5% - 3.0% ] 2.76% | 5,807 | 97.4% |
[ 2.5% - 3.0% ] 2.83% | 2,051 | 97.3% |
[ 2.5% - 3.0% ] 2.92% | 10,274 | 99.3% |
[ 2.5% - 3.0% ] 2.96% | 4,662 | 94.0% |
[ 3.0% - 3.5% ] 3.26% | 215 | 94.6% |
[ 3.5% - 4.0% ] 3.54% | 396 | 84.4% |
[ 3.5% - 4.0% ] 3.61% | 416 | 100.0% |
[ 3.5% - 4.0% ] 3.89% | 180 | 89.3% |
[ 4.0% - 4.5% ] 4.12% | 97 | 89.2% |
[ 4.0% - 4.5% ] 4.31% | 464 | 92.8% |
[ 4.0% - 4.5% ] 4.33% | 300 | 84.6% |
[ 4.0% - 4.5% ] 4.43% | 158 | 100.0% |
[ 4.0% - 4.5% ] 4.50% | 867 | 83.9% |
[ 4.5% - 5.0% ] 4.62% | 1,537 | 70.5% |
[ 4.5% - 5.0% ] 4.73% | 1,840 | 88.4% |
[ 5.0% - 5.5% ] 5.16% | 581 | 90.2% |
[ 5.5% - 6.0% ] 5.52% | 326 | 91.6% |
[ 5.5% - 6.0% ] 5.81% | 155 | 89.0% |
[ 6.0% - 6.5% ] 6.14% | 277 | 89.4% |
[ 6.0% - 6.5% ] 6.25% | 32 | 80.8% |
[ 6.5% - 7.0% ] 6.51% | 614 | 96.7% |
[ 6.5% - 7.0% ] 6.77% | 133 | 87.6% |
[ 6.5% - 7.0% ] 6.88% | 800 | 90.2% |
[ 7.0% - 7.5% ] 7.23% | 83 | 72.0% |
[ 7.5% - 8.0% ] 7.80% | 1,307 | 71.6% |
[ 9.5% - 10.0% ] 9.73% | 565 | 88.9% |
[ 12.0% - 12.5% ] 12.20% | 41 | 89.5% |
[ 12.0% - 12.5% ] 12.33% | 73 | 76.7% |
[ 13.5% - 14.0% ] 13.73% | 102 | 64.5% |