Bangladeshi Female Disability
COMPARE
Bangladeshi
Select to Compare
Female Disability
Bangladeshi Female Disability
13.1%
DISABILITY | FEMALES
0.0/ 100
METRIC RATING
285th/ 347
METRIC RANK
Bangladeshi Female Disability Correlation Chart
The statistical analysis conducted on geographies consisting of 141,386,461 people shows a poor negative correlation between the proportion of Bangladeshis and percentage of females with a disability in the United States with a correlation coefficient (R) of -0.136 and weighted average of 13.1%. On average, for every 1% (one percent) increase in Bangladeshis within a typical geography, there is a decrease of 0.049% in percentage of females with a disability.
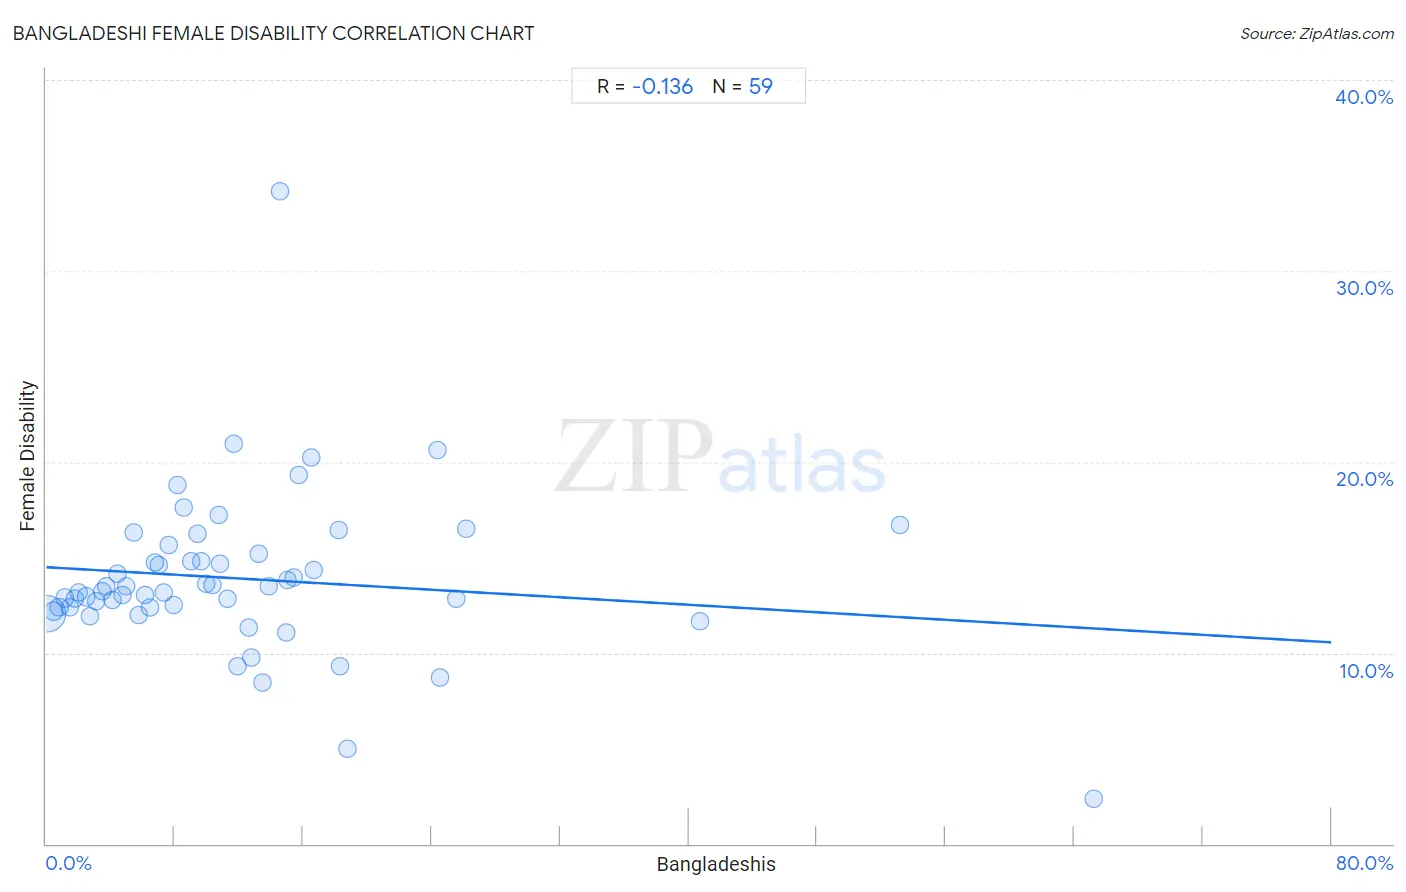
It is essential to understand that the correlation between the percentage of Bangladeshis and percentage of females with a disability does not imply a direct cause-and-effect relationship. It remains uncertain whether the presence of Bangladeshis influences an upward or downward trend in the level of percentage of females with a disability within an area, or if Bangladeshis simply ended up residing in those areas with higher or lower levels of percentage of females with a disability due to other factors.
Demographics Similar to Bangladeshis by Female Disability
In terms of female disability, the demographic groups most similar to Bangladeshis are Hmong (13.1%, a difference of 0.050%), Fijian (13.1%, a difference of 0.050%), English (13.1%, a difference of 0.18%), Welsh (13.1%, a difference of 0.19%), and U.S. Virgin Islander (13.1%, a difference of 0.27%).
| Demographics | Rating | Rank | Female Disability |
| Scottish | 0.1 /100 | #278 | Tragic 13.0% |
| Arapaho | 0.1 /100 | #279 | Tragic 13.0% |
| Irish | 0.1 /100 | #280 | Tragic 13.1% |
| U.S. Virgin Islanders | 0.1 /100 | #281 | Tragic 13.1% |
| Welsh | 0.0 /100 | #282 | Tragic 13.1% |
| English | 0.0 /100 | #283 | Tragic 13.1% |
| Hmong | 0.0 /100 | #284 | Tragic 13.1% |
| Bangladeshis | 0.0 /100 | #285 | Tragic 13.1% |
| Fijians | 0.0 /100 | #286 | Tragic 13.1% |
| Yaqui | 0.0 /100 | #287 | Tragic 13.2% |
| Whites/Caucasians | 0.0 /100 | #288 | Tragic 13.2% |
| Tlingit-Haida | 0.0 /100 | #289 | Tragic 13.2% |
| Immigrants from Yemen | 0.0 /100 | #290 | Tragic 13.2% |
| Shoshone | 0.0 /100 | #291 | Tragic 13.2% |
| Yakama | 0.0 /100 | #292 | Tragic 13.2% |
Bangladeshi Female Disability Correlation Summary
| Measurement | Bangladeshi Data | Female Disability Data |
| Minimum | 0.061% | 2.3% |
| Maximum | 65.2% | 34.2% |
| Range | 65.2% | 31.9% |
| Mean | 12.1% | 13.9% |
| Median | 9.6% | 13.3% |
| Interquartile 25% (IQ1) | 4.8% | 12.4% |
| Interquartile 75% (IQ3) | 15.0% | 15.2% |
| Interquartile Range (IQR) | 10.3% | 2.8% |
| Standard Deviation (Sample) | 11.8% | 4.2% |
| Standard Deviation (Population) | 11.7% | 4.2% |
Correlation Details
| Bangladeshi Percentile | Sample Size | Female Disability |
[ 0.0% - 0.5% ] 0.061% | 114,881,490 | 12.1% |
[ 0.0% - 0.5% ] 0.45% | 8,743,858 | 12.2% |
[ 0.5% - 1.0% ] 0.80% | 3,556,079 | 12.4% |
[ 1.0% - 1.5% ] 1.16% | 1,841,504 | 12.9% |
[ 1.0% - 1.5% ] 1.45% | 1,968,271 | 12.4% |
[ 1.5% - 2.0% ] 1.75% | 2,130,389 | 12.8% |
[ 2.0% - 2.5% ] 2.04% | 1,196,311 | 13.2% |
[ 2.0% - 2.5% ] 2.47% | 721,978 | 12.9% |
[ 2.5% - 3.0% ] 2.73% | 624,931 | 11.9% |
[ 3.0% - 3.5% ] 3.13% | 471,590 | 12.7% |
[ 3.0% - 3.5% ] 3.47% | 936,270 | 13.3% |
[ 3.5% - 4.0% ] 3.73% | 329,616 | 13.5% |
[ 4.0% - 4.5% ] 4.10% | 538,756 | 12.8% |
[ 4.0% - 4.5% ] 4.42% | 290,997 | 14.2% |
[ 4.5% - 5.0% ] 4.76% | 30,701 | 13.0% |
[ 4.5% - 5.0% ] 4.98% | 761,348 | 13.5% |
[ 5.0% - 5.5% ] 5.48% | 167,360 | 16.3% |
[ 5.5% - 6.0% ] 5.77% | 107,730 | 12.0% |
[ 6.0% - 6.5% ] 6.12% | 174,810 | 13.1% |
[ 6.0% - 6.5% ] 6.44% | 63,612 | 12.4% |
[ 6.5% - 7.0% ] 6.76% | 170,696 | 14.7% |
[ 6.5% - 7.0% ] 6.99% | 50,484 | 14.6% |
[ 7.0% - 7.5% ] 7.32% | 10,557 | 13.2% |
[ 7.5% - 8.0% ] 7.66% | 37,988 | 15.7% |
[ 7.5% - 8.0% ] 7.92% | 42,735 | 12.5% |
[ 8.0% - 8.5% ] 8.18% | 52,886 | 18.8% |
[ 8.5% - 9.0% ] 8.55% | 12,684 | 17.6% |
[ 9.0% - 9.5% ] 9.03% | 148,369 | 14.8% |
[ 9.0% - 9.5% ] 9.40% | 51,109 | 16.2% |
[ 9.5% - 10.0% ] 9.63% | 136,085 | 14.8% |
[ 9.5% - 10.0% ] 9.96% | 134,205 | 13.6% |
[ 10.0% - 10.5% ] 10.33% | 64,531 | 13.5% |
[ 10.5% - 11.0% ] 10.72% | 70,827 | 17.2% |
[ 10.5% - 11.0% ] 10.85% | 31,292 | 14.7% |
[ 11.0% - 11.5% ] 11.27% | 308,806 | 12.8% |
[ 11.5% - 12.0% ] 11.69% | 1,172 | 21.0% |
[ 11.5% - 12.0% ] 11.89% | 32,912 | 9.3% |
[ 12.5% - 13.0% ] 12.59% | 2,208 | 11.3% |
[ 12.5% - 13.0% ] 12.76% | 84,951 | 9.7% |
[ 13.0% - 13.5% ] 13.26% | 2,006 | 15.2% |
[ 13.0% - 13.5% ] 13.48% | 13,459 | 8.5% |
[ 13.5% - 14.0% ] 13.86% | 95,310 | 13.5% |
[ 14.5% - 15.0% ] 14.53% | 296 | 34.2% |
[ 14.5% - 15.0% ] 14.91% | 932 | 11.0% |
[ 15.0% - 15.5% ] 15.04% | 13,116 | 13.8% |
[ 15.0% - 15.5% ] 15.39% | 132,092 | 14.0% |
[ 15.5% - 16.0% ] 15.74% | 216 | 19.3% |
[ 16.0% - 16.5% ] 16.48% | 6,790 | 20.2% |
[ 16.5% - 17.0% ] 16.66% | 34,220 | 14.4% |
[ 18.0% - 18.5% ] 18.23% | 7,581 | 16.4% |
[ 18.0% - 18.5% ] 18.31% | 17,716 | 9.3% |
[ 18.5% - 19.0% ] 18.74% | 619 | 5.0% |
[ 24.0% - 24.5% ] 24.36% | 390 | 20.6% |
[ 24.5% - 25.0% ] 24.55% | 1,218 | 8.7% |
[ 25.5% - 26.0% ] 25.55% | 57,662 | 12.8% |
[ 26.0% - 26.5% ] 26.16% | 19,613 | 16.5% |
[ 40.5% - 41.0% ] 40.74% | 734 | 11.7% |
[ 53.0% - 53.5% ] 53.15% | 111 | 16.7% |
[ 65.0% - 65.5% ] 65.25% | 282 | 2.3% |