African Married-couple Households
COMPARE
African
Select to Compare
Married-couple Households
African Married-couple Households
40.9%
MARRIED-COUPLE HOUSEHOLDS
0.0/ 100
METRIC RATING
312th/ 347
METRIC RANK
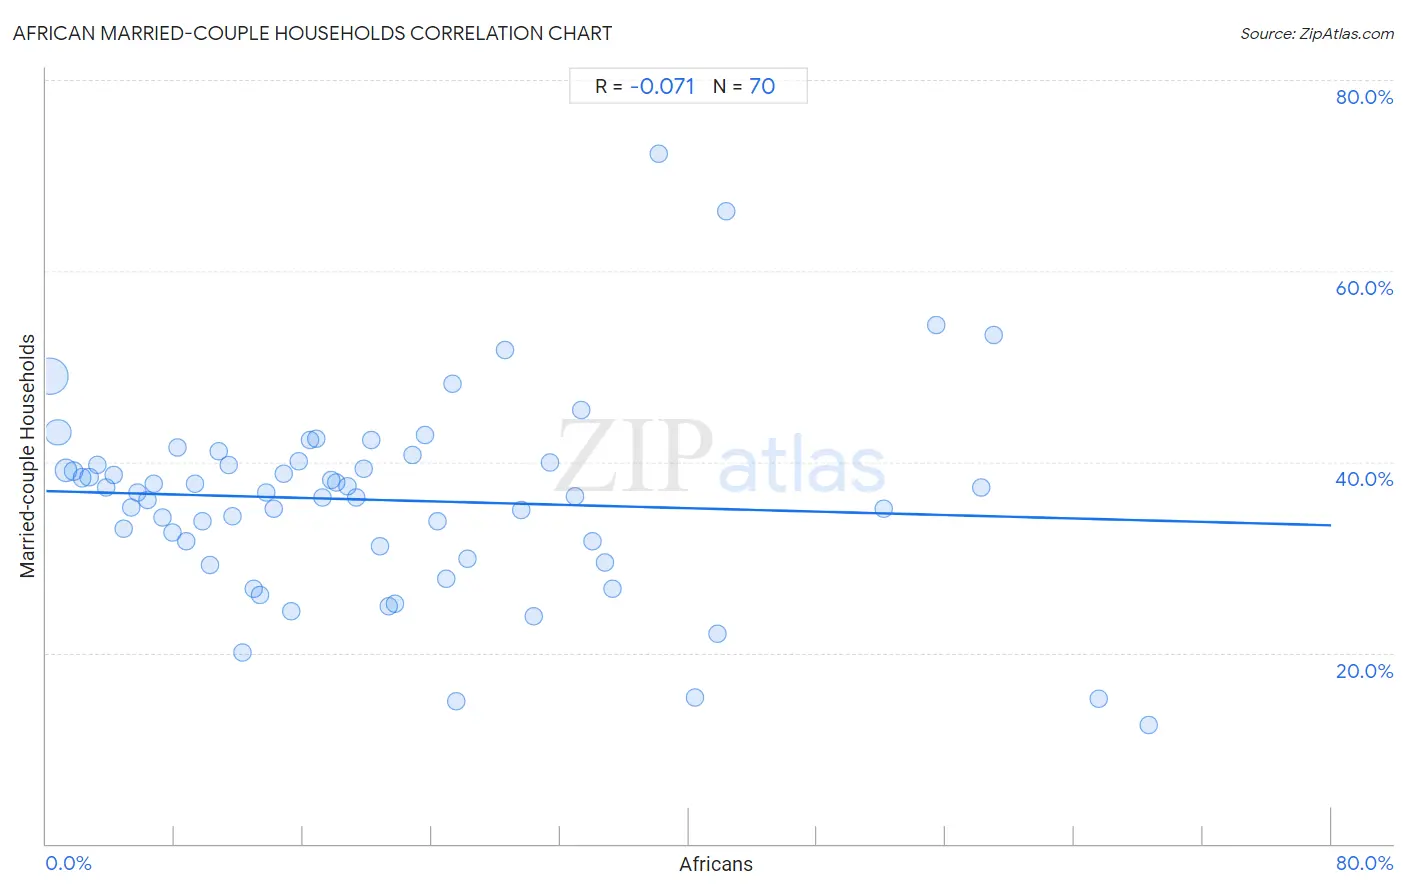
African Married-couple Households Correlation Chart
The statistical analysis conducted on geographies consisting of 469,585,166 people shows a slight negative correlation between the proportion of Africans and percentage of married-couple family households in the United States with a correlation coefficient (R) of -0.071 and weighted average of 40.9%. On average, for every 1% (one percent) increase in Africans within a typical geography, there is a decrease of 0.045% in percentage of married-couple family households.
It is essential to understand that the correlation between the percentage of Africans and percentage of married-couple family households does not imply a direct cause-and-effect relationship. It remains uncertain whether the presence of Africans influences an upward or downward trend in the level of percentage of married-couple family households within an area, or if Africans simply ended up residing in those areas with higher or lower levels of percentage of married-couple family households due to other factors.
Demographics Similar to Africans by Married-couple Households
In terms of married-couple households, the demographic groups most similar to Africans are Immigrants from Haiti (40.9%, a difference of 0.060%), Colville (41.0%, a difference of 0.090%), Jamaican (40.9%, a difference of 0.14%), Trinidadian and Tobagonian (40.9%, a difference of 0.22%), and Immigrants from Caribbean (40.8%, a difference of 0.40%).
| Demographics | Rating | Rank | Married-couple Households |
| Sioux | 0.0 /100 | #305 | Tragic 41.5% |
| Guyanese | 0.0 /100 | #306 | Tragic 41.4% |
| Immigrants from Western Africa | 0.0 /100 | #307 | Tragic 41.4% |
| Crow | 0.0 /100 | #308 | Tragic 41.4% |
| Immigrants from Trinidad and Tobago | 0.0 /100 | #309 | Tragic 41.2% |
| Haitians | 0.0 /100 | #310 | Tragic 41.2% |
| Colville | 0.0 /100 | #311 | Tragic 41.0% |
| Africans | 0.0 /100 | #312 | Tragic 40.9% |
| Immigrants from Haiti | 0.0 /100 | #313 | Tragic 40.9% |
| Jamaicans | 0.0 /100 | #314 | Tragic 40.9% |
| Trinidadians and Tobagonians | 0.0 /100 | #315 | Tragic 40.9% |
| Immigrants from Caribbean | 0.0 /100 | #316 | Tragic 40.8% |
| Immigrants from Jamaica | 0.0 /100 | #317 | Tragic 40.7% |
| Liberians | 0.0 /100 | #318 | Tragic 40.7% |
| Bahamians | 0.0 /100 | #319 | Tragic 40.5% |
African Married-couple Households Correlation Summary
| Measurement | African Data | Married-couple Households Data |
| Minimum | 0.21% | 12.5% |
| Maximum | 68.6% | 72.3% |
| Range | 68.4% | 59.8% |
| Mean | 21.0% | 36.0% |
| Median | 17.5% | 36.7% |
| Interquartile 25% (IQ1) | 8.7% | 31.1% |
| Interquartile 75% (IQ3) | 29.5% | 39.9% |
| Interquartile Range (IQR) | 20.8% | 8.8% |
| Standard Deviation (Sample) | 16.3% | 10.3% |
| Standard Deviation (Population) | 16.2% | 10.2% |
Correlation Details
| African Percentile | Sample Size | Married-couple Households |
[ 0.0% - 0.5% ] 0.21% | 253,243,192 | 48.9% |
[ 0.5% - 1.0% ] 0.72% | 105,799,588 | 43.1% |
[ 1.0% - 1.5% ] 1.21% | 58,309,546 | 39.1% |
[ 1.5% - 2.0% ] 1.72% | 21,018,926 | 39.0% |
[ 2.0% - 2.5% ] 2.23% | 10,659,788 | 38.3% |
[ 2.5% - 3.0% ] 2.68% | 7,847,949 | 38.4% |
[ 3.0% - 3.5% ] 3.20% | 4,248,736 | 39.7% |
[ 3.5% - 4.0% ] 3.71% | 1,825,704 | 37.3% |
[ 4.0% - 4.5% ] 4.22% | 1,254,328 | 38.6% |
[ 4.5% - 5.0% ] 4.82% | 1,340,608 | 33.0% |
[ 5.0% - 5.5% ] 5.26% | 830,137 | 35.2% |
[ 5.5% - 6.0% ] 5.71% | 460,804 | 36.7% |
[ 6.0% - 6.5% ] 6.31% | 407,479 | 36.0% |
[ 6.5% - 7.0% ] 6.70% | 495,497 | 37.7% |
[ 7.0% - 7.5% ] 7.25% | 287,773 | 34.2% |
[ 7.5% - 8.0% ] 7.83% | 202,093 | 32.6% |
[ 8.0% - 8.5% ] 8.19% | 161,548 | 41.5% |
[ 8.5% - 9.0% ] 8.70% | 159,998 | 31.7% |
[ 9.0% - 9.5% ] 9.27% | 166,494 | 37.7% |
[ 9.5% - 10.0% ] 9.74% | 68,122 | 33.8% |
[ 10.0% - 10.5% ] 10.22% | 135,361 | 29.1% |
[ 10.5% - 11.0% ] 10.72% | 230,443 | 41.1% |
[ 11.0% - 11.5% ] 11.34% | 9,772 | 39.7% |
[ 11.5% - 12.0% ] 11.63% | 26,091 | 34.3% |
[ 12.0% - 12.5% ] 12.23% | 13,222 | 20.1% |
[ 12.5% - 13.0% ] 12.93% | 23,227 | 26.7% |
[ 13.0% - 13.5% ] 13.31% | 4,891 | 26.0% |
[ 13.5% - 14.0% ] 13.70% | 5,197 | 36.8% |
[ 14.0% - 14.5% ] 14.17% | 15,888 | 35.1% |
[ 14.5% - 15.0% ] 14.77% | 104,025 | 38.7% |
[ 15.0% - 15.5% ] 15.28% | 22,936 | 24.4% |
[ 15.5% - 16.0% ] 15.73% | 11,906 | 40.1% |
[ 16.0% - 16.5% ] 16.42% | 67 | 42.3% |
[ 16.5% - 17.0% ] 16.79% | 7,755 | 42.4% |
[ 17.0% - 17.5% ] 17.20% | 16,886 | 36.3% |
[ 17.5% - 18.0% ] 17.74% | 2,672 | 38.1% |
[ 18.0% - 18.5% ] 18.06% | 40,302 | 37.8% |
[ 18.5% - 19.0% ] 18.74% | 19,765 | 37.4% |
[ 19.0% - 19.5% ] 19.30% | 710 | 36.3% |
[ 19.5% - 20.0% ] 19.75% | 13,660 | 39.3% |
[ 20.0% - 20.5% ] 20.24% | 3,305 | 42.2% |
[ 20.5% - 21.0% ] 20.81% | 3,239 | 31.1% |
[ 21.0% - 21.5% ] 21.32% | 15,443 | 24.9% |
[ 21.5% - 22.0% ] 21.72% | 7,110 | 25.1% |
[ 22.5% - 23.0% ] 22.80% | 9,501 | 40.8% |
[ 23.5% - 24.0% ] 23.56% | 365 | 42.9% |
[ 24.0% - 24.5% ] 24.38% | 25,084 | 33.8% |
[ 24.5% - 25.0% ] 24.91% | 273 | 27.7% |
[ 25.0% - 25.5% ] 25.30% | 1,170 | 48.2% |
[ 25.5% - 26.0% ] 25.54% | 881 | 15.0% |
[ 26.0% - 26.5% ] 26.24% | 2,138 | 29.9% |
[ 28.5% - 29.0% ] 28.57% | 154 | 51.7% |
[ 29.5% - 30.0% ] 29.55% | 44 | 35.0% |
[ 30.0% - 30.5% ] 30.36% | 606 | 23.9% |
[ 31.0% - 31.5% ] 31.35% | 2,485 | 39.9% |
[ 32.5% - 33.0% ] 32.93% | 334 | 36.4% |
[ 33.0% - 33.5% ] 33.33% | 39 | 45.5% |
[ 34.0% - 34.5% ] 34.01% | 1,476 | 31.7% |
[ 34.5% - 35.0% ] 34.78% | 46 | 29.4% |
[ 35.0% - 35.5% ] 35.23% | 1,286 | 26.7% |
[ 38.0% - 38.5% ] 38.10% | 4,572 | 72.3% |
[ 40.0% - 40.5% ] 40.41% | 9,613 | 15.3% |
[ 41.5% - 42.0% ] 41.76% | 613 | 22.0% |
[ 42.0% - 42.5% ] 42.31% | 338 | 66.3% |
[ 52.0% - 52.5% ] 52.17% | 46 | 35.1% |
[ 55.0% - 55.5% ] 55.41% | 231 | 54.3% |
[ 58.0% - 58.5% ] 58.19% | 574 | 37.3% |
[ 59.0% - 59.5% ] 59.02% | 549 | 53.2% |
[ 65.5% - 66.0% ] 65.55% | 479 | 15.2% |
[ 68.5% - 69.0% ] 68.60% | 86 | 12.5% |