African College, Under 1 year
COMPARE
African
Select to Compare
College, Under 1 year
African College, Under 1 year
61.1%
COLLEGE, UNDER 1 YEAR
0.3/ 100
METRIC RATING
261st/ 347
METRIC RANK
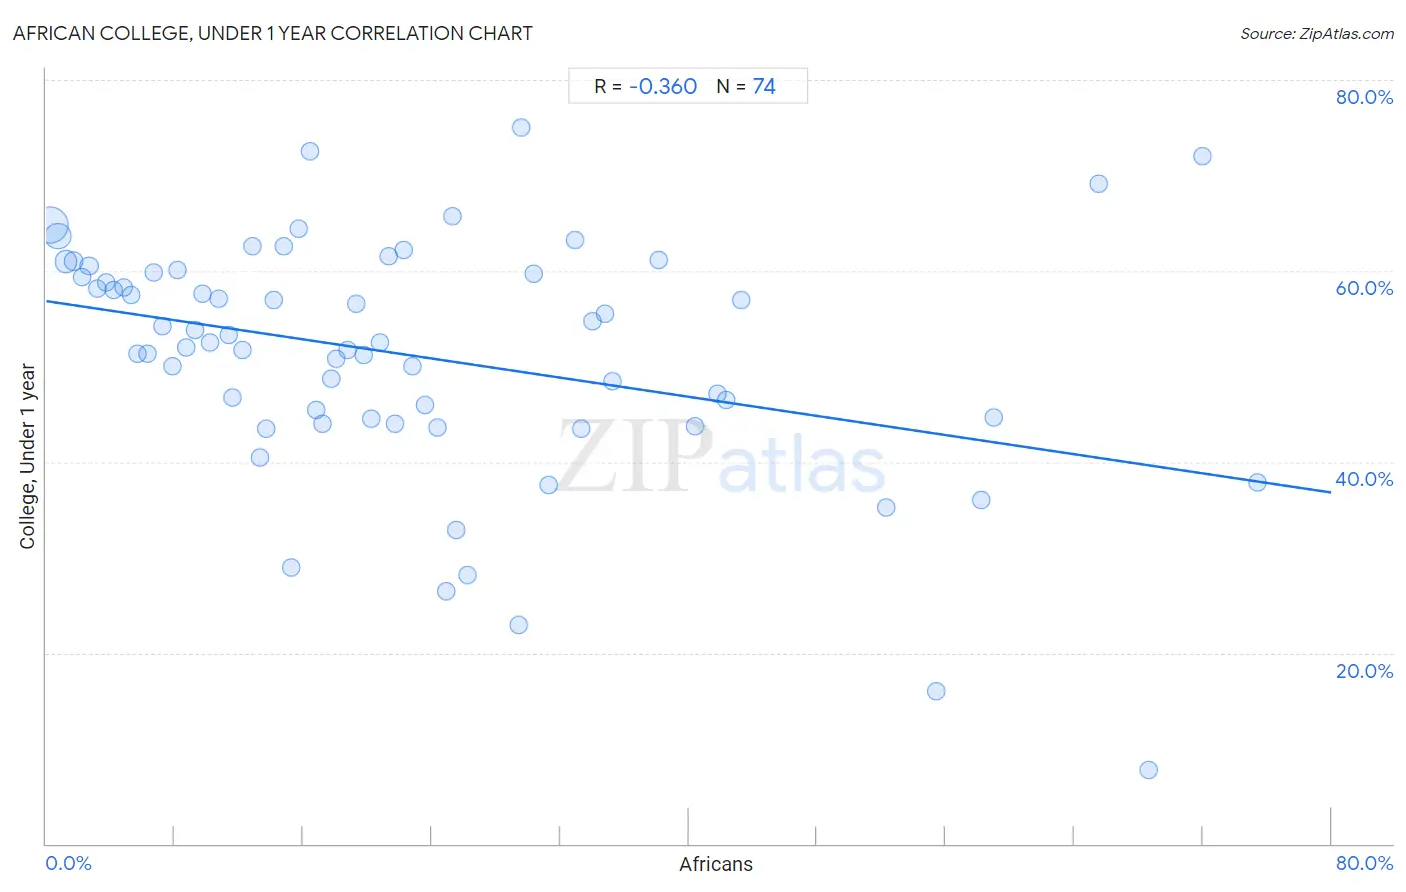
African College, Under 1 year Correlation Chart
The statistical analysis conducted on geographies consisting of 470,092,177 people shows a mild negative correlation between the proportion of Africans and percentage of population with at least college, under 1 year education in the United States with a correlation coefficient (R) of -0.360 and weighted average of 61.1%. On average, for every 1% (one percent) increase in Africans within a typical geography, there is a decrease of 0.25% in percentage of population with at least college, under 1 year education.
It is essential to understand that the correlation between the percentage of Africans and percentage of population with at least college, under 1 year education does not imply a direct cause-and-effect relationship. It remains uncertain whether the presence of Africans influences an upward or downward trend in the level of percentage of population with at least college, under 1 year education within an area, or if Africans simply ended up residing in those areas with higher or lower levels of percentage of population with at least college, under 1 year education due to other factors.
Demographics Similar to Africans by College, Under 1 year
In terms of college, under 1 year, the demographic groups most similar to Africans are Blackfeet (61.1%, a difference of 0.030%), Barbadian (61.1%, a difference of 0.040%), Shoshone (61.1%, a difference of 0.050%), Trinidadian and Tobagonian (61.1%, a difference of 0.11%), and Immigrants from Bahamas (61.1%, a difference of 0.11%).
| Demographics | Rating | Rank | College, Under 1 year |
| Immigrants from Cambodia | 0.4 /100 | #254 | Tragic 61.5% |
| Comanche | 0.4 /100 | #255 | Tragic 61.4% |
| Bangladeshis | 0.4 /100 | #256 | Tragic 61.4% |
| Immigrants from Laos | 0.3 /100 | #257 | Tragic 61.3% |
| Immigrants from Bangladesh | 0.3 /100 | #258 | Tragic 61.3% |
| Indonesians | 0.3 /100 | #259 | Tragic 61.2% |
| Blackfeet | 0.3 /100 | #260 | Tragic 61.1% |
| Africans | 0.3 /100 | #261 | Tragic 61.1% |
| Barbadians | 0.2 /100 | #262 | Tragic 61.1% |
| Shoshone | 0.2 /100 | #263 | Tragic 61.1% |
| Trinidadians and Tobagonians | 0.2 /100 | #264 | Tragic 61.1% |
| Immigrants from Bahamas | 0.2 /100 | #265 | Tragic 61.1% |
| Alaskan Athabascans | 0.2 /100 | #266 | Tragic 61.0% |
| Americans | 0.2 /100 | #267 | Tragic 61.0% |
| Immigrants from Trinidad and Tobago | 0.1 /100 | #268 | Tragic 60.7% |
African College, Under 1 year Correlation Summary
| Measurement | African Data | College, Under 1 year Data |
| Minimum | 0.21% | 7.7% |
| Maximum | 75.4% | 75.0% |
| Range | 75.2% | 67.3% |
| Mean | 22.7% | 51.2% |
| Median | 18.4% | 52.5% |
| Interquartile 25% (IQ1) | 9.3% | 44.5% |
| Interquartile 75% (IQ3) | 31.3% | 59.9% |
| Interquartile Range (IQR) | 22.1% | 15.4% |
| Standard Deviation (Sample) | 18.2% | 12.7% |
| Standard Deviation (Population) | 18.1% | 12.6% |
Correlation Details
| African Percentile | Sample Size | College, Under 1 year |
[ 0.0% - 0.5% ] 0.21% | 253,448,788 | 64.8% |
[ 0.5% - 1.0% ] 0.72% | 105,899,331 | 63.6% |
[ 1.0% - 1.5% ] 1.21% | 58,379,458 | 61.0% |
[ 1.5% - 2.0% ] 1.72% | 21,045,886 | 61.0% |
[ 2.0% - 2.5% ] 2.23% | 10,674,195 | 59.4% |
[ 2.5% - 3.0% ] 2.68% | 7,865,289 | 60.5% |
[ 3.0% - 3.5% ] 3.20% | 4,262,767 | 58.2% |
[ 3.5% - 4.0% ] 3.71% | 1,837,252 | 58.8% |
[ 4.0% - 4.5% ] 4.22% | 1,258,593 | 58.0% |
[ 4.5% - 5.0% ] 4.82% | 1,352,369 | 58.3% |
[ 5.0% - 5.5% ] 5.26% | 830,448 | 57.5% |
[ 5.5% - 6.0% ] 5.71% | 465,390 | 51.3% |
[ 6.0% - 6.5% ] 6.31% | 408,806 | 51.3% |
[ 6.5% - 7.0% ] 6.70% | 495,852 | 59.9% |
[ 7.0% - 7.5% ] 7.25% | 290,583 | 54.2% |
[ 7.5% - 8.0% ] 7.83% | 204,564 | 50.0% |
[ 8.0% - 8.5% ] 8.19% | 161,655 | 60.1% |
[ 8.5% - 9.0% ] 8.70% | 159,998 | 52.0% |
[ 9.0% - 9.5% ] 9.27% | 166,526 | 53.8% |
[ 9.5% - 10.0% ] 9.74% | 68,010 | 57.7% |
[ 10.0% - 10.5% ] 10.22% | 137,355 | 52.5% |
[ 10.5% - 11.0% ] 10.72% | 230,762 | 57.1% |
[ 11.0% - 11.5% ] 11.34% | 9,772 | 53.3% |
[ 11.5% - 12.0% ] 11.63% | 26,475 | 46.7% |
[ 12.0% - 12.5% ] 12.23% | 13,386 | 51.7% |
[ 12.5% - 13.0% ] 12.87% | 33,190 | 62.5% |
[ 13.0% - 13.5% ] 13.31% | 4,891 | 40.5% |
[ 13.5% - 14.0% ] 13.70% | 5,197 | 43.5% |
[ 14.0% - 14.5% ] 14.17% | 15,888 | 57.0% |
[ 14.5% - 15.0% ] 14.77% | 104,025 | 62.6% |
[ 15.0% - 15.5% ] 15.27% | 25,090 | 29.0% |
[ 15.5% - 16.0% ] 15.73% | 11,906 | 64.4% |
[ 16.0% - 16.5% ] 16.42% | 67 | 72.5% |
[ 16.5% - 17.0% ] 16.79% | 7,755 | 45.5% |
[ 17.0% - 17.5% ] 17.20% | 16,886 | 44.0% |
[ 17.5% - 18.0% ] 17.74% | 2,672 | 48.6% |
[ 18.0% - 18.5% ] 18.06% | 40,478 | 50.8% |
[ 18.5% - 19.0% ] 18.74% | 19,765 | 51.7% |
[ 19.0% - 19.5% ] 19.30% | 710 | 56.6% |
[ 19.5% - 20.0% ] 19.75% | 13,660 | 51.2% |
[ 20.0% - 20.5% ] 20.24% | 3,305 | 44.5% |
[ 20.5% - 21.0% ] 20.81% | 3,239 | 52.5% |
[ 21.0% - 21.5% ] 21.32% | 15,443 | 61.5% |
[ 21.5% - 22.0% ] 21.72% | 7,110 | 43.9% |
[ 22.0% - 22.5% ] 22.26% | 283 | 62.2% |
[ 22.5% - 23.0% ] 22.80% | 9,501 | 50.0% |
[ 23.5% - 24.0% ] 23.56% | 365 | 45.9% |
[ 24.0% - 24.5% ] 24.38% | 24,985 | 43.5% |
[ 24.5% - 25.0% ] 24.91% | 273 | 26.5% |
[ 25.0% - 25.5% ] 25.30% | 1,170 | 65.8% |
[ 25.5% - 26.0% ] 25.54% | 881 | 32.9% |
[ 26.0% - 26.5% ] 26.24% | 2,138 | 28.1% |
[ 29.0% - 29.5% ] 29.40% | 2,269 | 22.9% |
[ 29.5% - 30.0% ] 29.55% | 44 | 75.0% |
[ 30.0% - 30.5% ] 30.36% | 606 | 59.7% |
[ 31.0% - 31.5% ] 31.32% | 3,796 | 37.6% |
[ 32.5% - 33.0% ] 32.93% | 334 | 63.2% |
[ 33.0% - 33.5% ] 33.33% | 54 | 43.5% |
[ 34.0% - 34.5% ] 34.01% | 1,476 | 54.8% |
[ 34.5% - 35.0% ] 34.78% | 46 | 55.6% |
[ 35.0% - 35.5% ] 35.23% | 1,286 | 48.5% |
[ 38.0% - 38.5% ] 38.10% | 4,572 | 61.1% |
[ 40.0% - 40.5% ] 40.41% | 9,613 | 43.7% |
[ 41.5% - 42.0% ] 41.76% | 613 | 47.2% |
[ 42.0% - 42.5% ] 42.31% | 338 | 46.5% |
[ 43.0% - 43.5% ] 43.29% | 633 | 56.9% |
[ 52.0% - 52.5% ] 52.27% | 88 | 35.2% |
[ 55.0% - 55.5% ] 55.41% | 231 | 16.0% |
[ 58.0% - 58.5% ] 58.19% | 574 | 36.0% |
[ 59.0% - 59.5% ] 59.02% | 549 | 44.7% |
[ 65.5% - 66.0% ] 65.55% | 479 | 69.1% |
[ 68.5% - 69.0% ] 68.60% | 86 | 7.7% |
[ 72.0% - 72.5% ] 72.00% | 50 | 72.0% |
[ 75.0% - 75.5% ] 75.44% | 57 | 37.8% |