Vietnamese 2 or more Vehicles in Household
COMPARE
Vietnamese
Select to Compare
2 or more Vehicles in Household
Vietnamese 2 or more Vehicles in Household
38.5%
2+ VEHICLES AVAILABLE
0.0/ 100
METRIC RATING
336th/ 347
METRIC RANK
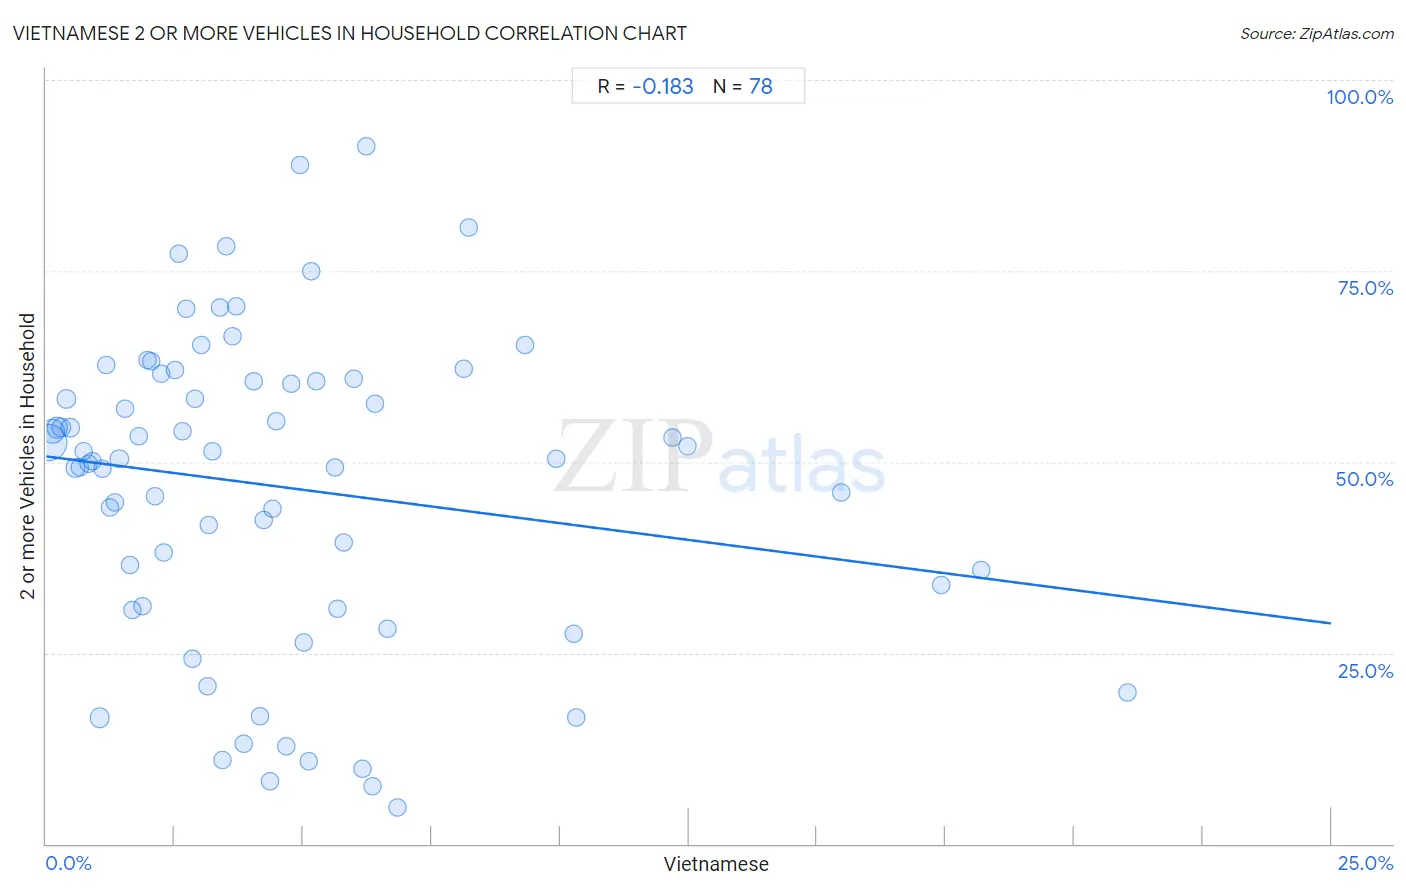
Vietnamese 2 or more Vehicles in Household Correlation Chart
The statistical analysis conducted on geographies consisting of 170,680,365 people shows a poor negative correlation between the proportion of Vietnamese and percentage of households with 2 or more vehicles available in the United States with a correlation coefficient (R) of -0.183 and weighted average of 38.5%. On average, for every 1% (one percent) increase in Vietnamese within a typical geography, there is a decrease of 0.87% in percentage of households with 2 or more vehicles available.
It is essential to understand that the correlation between the percentage of Vietnamese and percentage of households with 2 or more vehicles available does not imply a direct cause-and-effect relationship. It remains uncertain whether the presence of Vietnamese influences an upward or downward trend in the level of percentage of households with 2 or more vehicles available within an area, or if Vietnamese simply ended up residing in those areas with higher or lower levels of percentage of households with 2 or more vehicles available due to other factors.
Demographics Similar to Vietnamese by 2 or more Vehicles in Household
In terms of 2 or more vehicles in household, the demographic groups most similar to Vietnamese are Barbadian (38.3%, a difference of 0.41%), Immigrants from Bangladesh (38.8%, a difference of 0.72%), Immigrants from Uzbekistan (37.9%, a difference of 1.6%), Immigrants from Trinidad and Tobago (40.3%, a difference of 4.6%), and Immigrants from Ecuador (40.5%, a difference of 5.2%).
| Demographics | Rating | Rank | 2 or more Vehicles in Household |
| Ecuadorians | 0.0 /100 | #329 | Tragic 42.0% |
| Immigrants from Dominica | 0.0 /100 | #330 | Tragic 41.6% |
| West Indians | 0.0 /100 | #331 | Tragic 41.3% |
| Trinidadians and Tobagonians | 0.0 /100 | #332 | Tragic 40.9% |
| Immigrants from Ecuador | 0.0 /100 | #333 | Tragic 40.5% |
| Immigrants from Trinidad and Tobago | 0.0 /100 | #334 | Tragic 40.3% |
| Immigrants from Bangladesh | 0.0 /100 | #335 | Tragic 38.8% |
| Vietnamese | 0.0 /100 | #336 | Tragic 38.5% |
| Barbadians | 0.0 /100 | #337 | Tragic 38.3% |
| Immigrants from Uzbekistan | 0.0 /100 | #338 | Tragic 37.9% |
| Immigrants from Barbados | 0.0 /100 | #339 | Tragic 35.8% |
| British West Indians | 0.0 /100 | #340 | Tragic 35.4% |
| Guyanese | 0.0 /100 | #341 | Tragic 35.4% |
| Dominicans | 0.0 /100 | #342 | Tragic 35.3% |
| Immigrants from Guyana | 0.0 /100 | #343 | Tragic 35.0% |
Vietnamese 2 or more Vehicles in Household Correlation Summary
| Measurement | Vietnamese Data | 2 or more Vehicles in Household Data |
| Minimum | 0.038% | 4.7% |
| Maximum | 21.0% | 91.3% |
| Range | 21.0% | 86.6% |
| Mean | 4.6% | 46.7% |
| Median | 3.5% | 50.4% |
| Interquartile 25% (IQ1) | 1.7% | 31.1% |
| Interquartile 75% (IQ3) | 5.8% | 60.6% |
| Interquartile Range (IQR) | 4.1% | 29.5% |
| Standard Deviation (Sample) | 4.3% | 20.3% |
| Standard Deviation (Population) | 4.2% | 20.2% |
Correlation Details
| Vietnamese Percentile | Sample Size | 2 or more Vehicles in Household |
[ 0.0% - 0.5% ] 0.038% | 90,686,798 | 52.5% |
[ 0.0% - 0.5% ] 0.12% | 29,636,673 | 54.0% |
[ 0.0% - 0.5% ] 0.21% | 15,126,214 | 54.5% |
[ 0.0% - 0.5% ] 0.30% | 6,462,564 | 54.5% |
[ 0.0% - 0.5% ] 0.39% | 4,478,061 | 58.2% |
[ 0.0% - 0.5% ] 0.47% | 4,257,301 | 54.5% |
[ 0.5% - 1.0% ] 0.57% | 2,004,004 | 49.2% |
[ 0.5% - 1.0% ] 0.64% | 1,397,935 | 49.3% |
[ 0.5% - 1.0% ] 0.73% | 760,725 | 51.4% |
[ 0.5% - 1.0% ] 0.83% | 1,007,831 | 49.8% |
[ 0.5% - 1.0% ] 0.91% | 639,351 | 50.1% |
[ 1.0% - 1.5% ] 1.04% | 9,325,869 | 16.5% |
[ 1.0% - 1.5% ] 1.09% | 309,952 | 49.0% |
[ 1.0% - 1.5% ] 1.16% | 315,981 | 62.7% |
[ 1.0% - 1.5% ] 1.24% | 264,442 | 44.1% |
[ 1.0% - 1.5% ] 1.34% | 778,051 | 44.6% |
[ 1.0% - 1.5% ] 1.42% | 284,654 | 50.3% |
[ 1.5% - 2.0% ] 1.54% | 43,867 | 56.9% |
[ 1.5% - 2.0% ] 1.62% | 199,885 | 36.5% |
[ 1.5% - 2.0% ] 1.69% | 199,200 | 30.5% |
[ 1.5% - 2.0% ] 1.81% | 123,795 | 53.4% |
[ 1.5% - 2.0% ] 1.88% | 146,617 | 31.1% |
[ 1.5% - 2.0% ] 1.96% | 22,008 | 63.3% |
[ 2.0% - 2.5% ] 2.05% | 94,083 | 63.1% |
[ 2.0% - 2.5% ] 2.13% | 143,886 | 45.5% |
[ 2.0% - 2.5% ] 2.23% | 53,029 | 61.5% |
[ 2.0% - 2.5% ] 2.29% | 195,433 | 38.1% |
[ 2.5% - 3.0% ] 2.50% | 11,309 | 62.1% |
[ 2.5% - 3.0% ] 2.58% | 3,183 | 77.3% |
[ 2.5% - 3.0% ] 2.64% | 138,588 | 53.9% |
[ 2.5% - 3.0% ] 2.72% | 14,685 | 70.0% |
[ 2.5% - 3.0% ] 2.85% | 83,275 | 24.2% |
[ 2.5% - 3.0% ] 2.89% | 25,324 | 58.2% |
[ 3.0% - 3.5% ] 3.02% | 5,095 | 65.4% |
[ 3.0% - 3.5% ] 3.13% | 45,881 | 20.6% |
[ 3.0% - 3.5% ] 3.17% | 54,323 | 41.8% |
[ 3.0% - 3.5% ] 3.24% | 15,503 | 51.5% |
[ 3.0% - 3.5% ] 3.38% | 8,879 | 70.3% |
[ 3.0% - 3.5% ] 3.43% | 186,165 | 11.0% |
[ 3.0% - 3.5% ] 3.50% | 2,230 | 78.2% |
[ 3.5% - 4.0% ] 3.61% | 7,775 | 66.5% |
[ 3.5% - 4.0% ] 3.69% | 7,692 | 70.5% |
[ 3.5% - 4.0% ] 3.84% | 44,898 | 13.1% |
[ 4.0% - 4.5% ] 4.04% | 19,750 | 60.6% |
[ 4.0% - 4.5% ] 4.16% | 28,164 | 16.7% |
[ 4.0% - 4.5% ] 4.24% | 69,256 | 42.4% |
[ 4.0% - 4.5% ] 4.34% | 67,001 | 8.1% |
[ 4.0% - 4.5% ] 4.40% | 19,554 | 43.9% |
[ 4.0% - 4.5% ] 4.47% | 5,120 | 55.4% |
[ 4.5% - 5.0% ] 4.67% | 68,656 | 12.8% |
[ 4.5% - 5.0% ] 4.75% | 27,848 | 60.2% |
[ 4.5% - 5.0% ] 4.93% | 548 | 88.9% |
[ 5.0% - 5.5% ] 5.01% | 46,520 | 26.3% |
[ 5.0% - 5.5% ] 5.10% | 77,230 | 10.8% |
[ 5.0% - 5.5% ] 5.15% | 6,510 | 75.0% |
[ 5.0% - 5.5% ] 5.25% | 6,965 | 60.5% |
[ 5.5% - 6.0% ] 5.62% | 30,063 | 49.2% |
[ 5.5% - 6.0% ] 5.67% | 43,216 | 30.7% |
[ 5.5% - 6.0% ] 5.78% | 25,187 | 39.4% |
[ 5.5% - 6.0% ] 5.99% | 3,958 | 60.9% |
[ 6.0% - 6.5% ] 6.16% | 86,977 | 9.9% |
[ 6.0% - 6.5% ] 6.23% | 1,460 | 91.3% |
[ 6.0% - 6.5% ] 6.34% | 102,618 | 7.5% |
[ 6.0% - 6.5% ] 6.39% | 10,691 | 57.6% |
[ 6.5% - 7.0% ] 6.64% | 29,441 | 28.2% |
[ 6.5% - 7.0% ] 6.83% | 26,939 | 4.7% |
[ 8.0% - 8.5% ] 8.12% | 4,064 | 62.2% |
[ 8.0% - 8.5% ] 8.21% | 1,900 | 80.7% |
[ 9.0% - 9.5% ] 9.30% | 344 | 65.2% |
[ 9.5% - 10.0% ] 9.92% | 2,571 | 50.4% |
[ 10.0% - 10.5% ] 10.27% | 38,865 | 27.5% |
[ 10.0% - 10.5% ] 10.32% | 59,961 | 16.5% |
[ 12.0% - 12.5% ] 12.18% | 3,006 | 53.2% |
[ 12.0% - 12.5% ] 12.48% | 17,328 | 52.0% |
[ 15.0% - 15.5% ] 15.46% | 317 | 46.0% |
[ 17.0% - 17.5% ] 17.42% | 27,842 | 33.8% |
[ 18.0% - 18.5% ] 18.18% | 43,213 | 35.9% |
[ 21.0% - 21.5% ] 21.03% | 64,268 | 19.9% |