Vietnamese GED/Equivalency
COMPARE
Vietnamese
Select to Compare
GED/Equivalency
Vietnamese GED/Equivalency
81.9%
GED/EQUIVALENCY
0.0/ 100
METRIC RATING
296th/ 347
METRIC RANK
Vietnamese GED/Equivalency Correlation Chart
The statistical analysis conducted on geographies consisting of 170,753,564 people shows a mild negative correlation between the proportion of Vietnamese and percentage of population with at least ged/equivalency education in the United States with a correlation coefficient (R) of -0.332 and weighted average of 81.9%. On average, for every 1% (one percent) increase in Vietnamese within a typical geography, there is a decrease of 0.64% in percentage of population with at least ged/equivalency education.
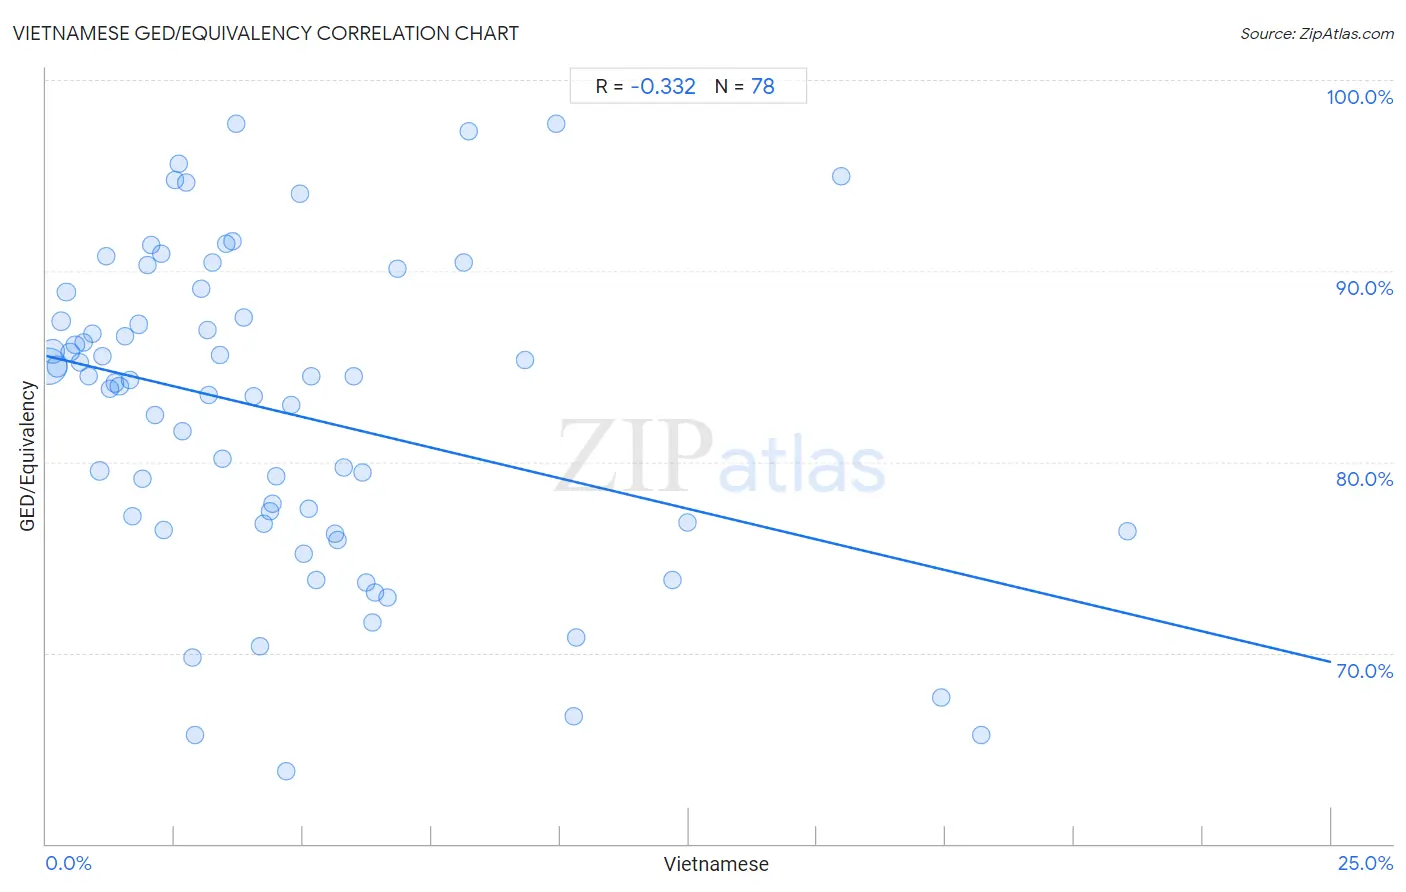
It is essential to understand that the correlation between the percentage of Vietnamese and percentage of population with at least ged/equivalency education does not imply a direct cause-and-effect relationship. It remains uncertain whether the presence of Vietnamese influences an upward or downward trend in the level of percentage of population with at least ged/equivalency education within an area, or if Vietnamese simply ended up residing in those areas with higher or lower levels of percentage of population with at least ged/equivalency education due to other factors.
Demographics Similar to Vietnamese by GED/Equivalency
In terms of ged/equivalency, the demographic groups most similar to Vietnamese are Nepalese (81.9%, a difference of 0.030%), Immigrants from Bangladesh (81.9%, a difference of 0.040%), Immigrants from St. Vincent and the Grenadines (82.0%, a difference of 0.090%), British West Indian (82.0%, a difference of 0.11%), and Paiute (82.0%, a difference of 0.12%).
| Demographics | Rating | Rank | GED/Equivalency |
| Immigrants from Cambodia | 0.0 /100 | #289 | Tragic 82.2% |
| Haitians | 0.0 /100 | #290 | Tragic 82.1% |
| Cubans | 0.0 /100 | #291 | Tragic 82.0% |
| Paiute | 0.0 /100 | #292 | Tragic 82.0% |
| British West Indians | 0.0 /100 | #293 | Tragic 82.0% |
| Immigrants from St. Vincent and the Grenadines | 0.0 /100 | #294 | Tragic 82.0% |
| Nepalese | 0.0 /100 | #295 | Tragic 81.9% |
| Vietnamese | 0.0 /100 | #296 | Tragic 81.9% |
| Immigrants from Bangladesh | 0.0 /100 | #297 | Tragic 81.9% |
| Ute | 0.0 /100 | #298 | Tragic 81.8% |
| Ecuadorians | 0.0 /100 | #299 | Tragic 81.7% |
| Fijians | 0.0 /100 | #300 | Tragic 81.6% |
| Dutch West Indians | 0.0 /100 | #301 | Tragic 81.6% |
| Immigrants from Haiti | 0.0 /100 | #302 | Tragic 81.6% |
| Immigrants from Portugal | 0.0 /100 | #303 | Tragic 81.6% |
Vietnamese GED/Equivalency Correlation Summary
| Measurement | Vietnamese Data | GED/Equivalency Data |
| Minimum | 0.038% | 63.8% |
| Maximum | 21.0% | 97.7% |
| Range | 21.0% | 34.0% |
| Mean | 4.6% | 82.6% |
| Median | 3.5% | 84.2% |
| Interquartile 25% (IQ1) | 1.7% | 76.8% |
| Interquartile 75% (IQ3) | 5.8% | 87.6% |
| Interquartile Range (IQR) | 4.1% | 10.8% |
| Standard Deviation (Sample) | 4.3% | 8.2% |
| Standard Deviation (Population) | 4.2% | 8.1% |
Correlation Details
| Vietnamese Percentile | Sample Size | GED/Equivalency |
[ 0.0% - 0.5% ] 0.038% | 90,686,798 | 85.0% |
[ 0.0% - 0.5% ] 0.12% | 29,655,382 | 85.8% |
[ 0.0% - 0.5% ] 0.21% | 15,133,735 | 85.0% |
[ 0.0% - 0.5% ] 0.30% | 6,472,659 | 87.4% |
[ 0.0% - 0.5% ] 0.39% | 4,478,061 | 88.9% |
[ 0.0% - 0.5% ] 0.47% | 4,259,362 | 85.8% |
[ 0.5% - 1.0% ] 0.57% | 2,004,004 | 86.1% |
[ 0.5% - 1.0% ] 0.64% | 1,406,538 | 85.2% |
[ 0.5% - 1.0% ] 0.73% | 770,482 | 86.3% |
[ 0.5% - 1.0% ] 0.83% | 1,007,831 | 84.5% |
[ 0.5% - 1.0% ] 0.91% | 639,351 | 86.7% |
[ 1.0% - 1.5% ] 1.04% | 9,325,869 | 79.5% |
[ 1.0% - 1.5% ] 1.09% | 310,510 | 85.6% |
[ 1.0% - 1.5% ] 1.16% | 323,186 | 90.8% |
[ 1.0% - 1.5% ] 1.24% | 264,442 | 83.8% |
[ 1.0% - 1.5% ] 1.34% | 781,137 | 84.1% |
[ 1.0% - 1.5% ] 1.42% | 287,008 | 83.9% |
[ 1.5% - 2.0% ] 1.54% | 43,867 | 86.6% |
[ 1.5% - 2.0% ] 1.62% | 201,906 | 84.3% |
[ 1.5% - 2.0% ] 1.69% | 199,200 | 77.2% |
[ 1.5% - 2.0% ] 1.81% | 123,795 | 87.2% |
[ 1.5% - 2.0% ] 1.88% | 147,846 | 79.1% |
[ 1.5% - 2.0% ] 1.96% | 22,008 | 90.3% |
[ 2.0% - 2.5% ] 2.05% | 94,083 | 91.4% |
[ 2.0% - 2.5% ] 2.13% | 143,886 | 82.5% |
[ 2.0% - 2.5% ] 2.23% | 53,029 | 90.9% |
[ 2.0% - 2.5% ] 2.29% | 195,433 | 76.5% |
[ 2.5% - 3.0% ] 2.50% | 11,309 | 94.8% |
[ 2.5% - 3.0% ] 2.58% | 3,183 | 95.6% |
[ 2.5% - 3.0% ] 2.64% | 138,588 | 81.6% |
[ 2.5% - 3.0% ] 2.72% | 14,685 | 94.7% |
[ 2.5% - 3.0% ] 2.85% | 83,275 | 69.8% |
[ 2.5% - 3.0% ] 2.89% | 25,324 | 65.7% |
[ 3.0% - 3.5% ] 3.02% | 5,095 | 89.0% |
[ 3.0% - 3.5% ] 3.13% | 45,881 | 86.9% |
[ 3.0% - 3.5% ] 3.17% | 54,323 | 83.5% |
[ 3.0% - 3.5% ] 3.24% | 15,503 | 90.4% |
[ 3.0% - 3.5% ] 3.38% | 8,879 | 85.6% |
[ 3.0% - 3.5% ] 3.43% | 186,165 | 80.1% |
[ 3.0% - 3.5% ] 3.50% | 2,230 | 91.4% |
[ 3.5% - 4.0% ] 3.61% | 7,775 | 91.5% |
[ 3.5% - 4.0% ] 3.69% | 7,692 | 97.7% |
[ 3.5% - 4.0% ] 3.84% | 44,898 | 87.6% |
[ 4.0% - 4.5% ] 4.04% | 19,750 | 83.4% |
[ 4.0% - 4.5% ] 4.16% | 28,164 | 70.4% |
[ 4.0% - 4.5% ] 4.24% | 69,256 | 76.8% |
[ 4.0% - 4.5% ] 4.34% | 67,001 | 77.4% |
[ 4.0% - 4.5% ] 4.40% | 19,554 | 77.8% |
[ 4.0% - 4.5% ] 4.47% | 5,120 | 79.2% |
[ 4.5% - 5.0% ] 4.67% | 68,656 | 63.8% |
[ 4.5% - 5.0% ] 4.75% | 27,848 | 83.0% |
[ 4.5% - 5.0% ] 4.93% | 548 | 94.0% |
[ 5.0% - 5.5% ] 5.01% | 46,520 | 75.2% |
[ 5.0% - 5.5% ] 5.10% | 77,230 | 77.6% |
[ 5.0% - 5.5% ] 5.15% | 6,510 | 84.5% |
[ 5.0% - 5.5% ] 5.25% | 6,965 | 73.8% |
[ 5.5% - 6.0% ] 5.62% | 30,063 | 76.2% |
[ 5.5% - 6.0% ] 5.67% | 43,216 | 75.9% |
[ 5.5% - 6.0% ] 5.78% | 25,187 | 79.7% |
[ 5.5% - 6.0% ] 5.99% | 3,958 | 84.5% |
[ 6.0% - 6.5% ] 6.16% | 86,977 | 79.4% |
[ 6.0% - 6.5% ] 6.23% | 1,460 | 73.7% |
[ 6.0% - 6.5% ] 6.34% | 102,618 | 71.6% |
[ 6.0% - 6.5% ] 6.39% | 10,691 | 73.2% |
[ 6.5% - 7.0% ] 6.64% | 29,441 | 72.9% |
[ 6.5% - 7.0% ] 6.83% | 26,939 | 90.1% |
[ 8.0% - 8.5% ] 8.12% | 4,064 | 90.4% |
[ 8.0% - 8.5% ] 8.21% | 1,900 | 97.3% |
[ 9.0% - 9.5% ] 9.30% | 344 | 85.3% |
[ 9.5% - 10.0% ] 9.92% | 2,571 | 97.7% |
[ 10.0% - 10.5% ] 10.27% | 38,865 | 66.7% |
[ 10.0% - 10.5% ] 10.32% | 59,961 | 70.8% |
[ 12.0% - 12.5% ] 12.18% | 3,006 | 73.8% |
[ 12.0% - 12.5% ] 12.48% | 17,328 | 76.9% |
[ 15.0% - 15.5% ] 15.46% | 317 | 95.0% |
[ 17.0% - 17.5% ] 17.42% | 27,842 | 67.7% |
[ 18.0% - 18.5% ] 18.18% | 43,213 | 65.7% |
[ 21.0% - 21.5% ] 21.03% | 64,268 | 76.4% |