Swiss Married-Couple Family Poverty

COMPARE

Swiss
Race
Ancestry
AfghanAfricanAlaska NativeAlaskan AthabascanAlbanianAleutAlsatianAmericanApacheArabArapahoArgentineanArmenianAssyrian/Chaldean/SyriacAustralianAustrianBahamianBangladeshiBarbadianBasqueBelgianBelizeanBermudanBhutaneseBlackfeetBolivianBrazilianBritishBritish West IndianBulgarianBurmeseCajunCambodianCanadianCape VerdeanCarpatho RusynCelticCentral AmericanCentral American IndianCherokeeCheyenneChickasawChileanChineseChippewaChoctawColombianColvilleComancheCosta RicanCreeCreekCroatianCrowCubanCypriotCzechCzechoslovakianDanishDelawareDominicanDutchDutch West IndianEastern EuropeanEcuadorianEgyptianEnglishEstonianEthiopianEuropeanFijianFilipinoFinnishFrenchFrench American IndianFrench CanadianGermanGerman RussianGhanaianGreekGuamanian/ChamorroGuatemalanGuyaneseHaitianHmongHonduranHopiHoumaHungarianIcelanderIndian (Asian)IndonesianInupiatIranianIraqiIrishIroquoisIsraeliItalianJamaicanJapaneseJordanianKenyanKiowaKoreanLaotianLatvianLebaneseLiberianLithuanianLumbeeLuxembourgerMacedonianMalaysianMalteseMarshalleseMenomineeMexicanMexican American IndianMongolianMoroccanNative HawaiianNavajoNepaleseNew ZealanderNicaraguanNigerianNorthern EuropeanNorwegianOkinawanOsageOttawaPaiutePakistaniPalestinianPanamanianParaguayanPennsylvania GermanPeruvianPimaPolishPortuguesePotawatomiPuebloPuerto RicanPuget Sound SalishRomanianRussianSalvadoranSamoanScandinavianScotch-IrishScottishSeminoleSenegaleseSerbianShoshoneSierra LeoneanSiouxSlavicSlovakSloveneSomaliSouth AfricanSouth AmericanSouth American IndianSoviet UnionSpaniardSpanishSpanish AmericanSpanish American IndianSri LankanSubsaharan AfricanSudaneseSwedishSwissSyrianTaiwaneseThaiTlingit-HaidaTohono O'OdhamTonganTrinidadian and TobagonianTsimshianTurkishU.S. Virgin IslanderUgandanUkrainianUruguayanUteVenezuelanVietnameseWelshWest IndianYakamaYaquiYugoslavianYumanYup'ikZimbabwean
Immigration
NonimmigrantsImmigrantsAfghanistanAfricaAlbaniaArgentinaArmeniaAsiaAustraliaAustriaBahamasBangladeshBarbadosBelarusBelgiumBelizeBoliviaBosnia and HerzegovinaBrazilBulgariaBurma/MyanmarCabo VerdeCambodiaCameroonCanadaCaribbeanCentral AmericaChileChinaColombiaCongoCosta RicaCroatiaCubaCzechoslovakiaDenmarkDominicaDominican RepublicEastern AfricaEastern AsiaEastern EuropeEcuadorEgyptEl SalvadorEnglandEritreaEthiopiaEuropeFijiFranceGermanyGhanaGreeceGrenadaGuatemalaGuyanaHaitiHondurasHong KongHungaryIndiaIndonesiaIranIraqIrelandIsraelItalyJamaicaJapanJordanKazakhstanKenyaKoreaKuwaitLaosLatin AmericaLatviaLebanonLiberiaLithuaniaMalaysiaMexicoMicronesiaMiddle AfricaMoldovaMoroccoNepalNetherlandsNicaraguaNigeriaNorth AmericaNorth MacedoniaNorthern AfricaNorthern EuropeNorwayOceaniaPakistanPanamaPeruPhilippinesPolandPortugalRomaniaRussiaSaudi ArabiaScotlandSenegalSerbiaSierra LeoneSingaporeSomaliaSouth AfricaSouth AmericaSouth Central AsiaSouth Eastern AsiaSouthern EuropeSpainSri LankaSt. Vincent and the GrenadinesSudanSwedenSwitzerlandSyriaTaiwanThailandTrinidad and TobagoTurkeyUgandaUkraineUruguayUzbekistanVenezuelaVietnamWest IndiesWestern AfricaWestern AsiaWestern EuropeYemenZaireZimbabweAzores
Select to Compare
Race
Ancestry
AfghanAfricanAlaska NativeAlaskan AthabascanAlbanianAleutAlsatianAmericanApacheArabArapahoArgentineanArmenianAssyrian/Chaldean/SyriacAustralianAustrianBahamianBangladeshiBarbadianBasqueBelgianBelizeanBermudanBhutaneseBlackfeetBolivianBrazilianBritishBritish West IndianBulgarianBurmeseCajunCambodianCanadianCape VerdeanCarpatho RusynCelticCentral AmericanCentral American IndianCherokeeCheyenneChickasawChileanChineseChippewaChoctawColombianColvilleComancheCosta RicanCreeCreekCroatianCrowCubanCypriotCzechCzechoslovakianDanishDelawareDominicanDutchDutch West IndianEastern EuropeanEcuadorianEgyptianEnglishEstonianEthiopianEuropeanFijianFilipinoFinnishFrenchFrench American IndianFrench CanadianGermanGerman RussianGhanaianGreekGuamanian/ChamorroGuatemalanGuyaneseHaitianHmongHonduranHopiHoumaHungarianIcelanderIndian (Asian)IndonesianInupiatIranianIraqiIrishIroquoisIsraeliItalianJamaicanJapaneseJordanianKenyanKiowaKoreanLaotianLatvianLebaneseLiberianLithuanianLumbeeLuxembourgerMacedonianMalaysianMalteseMarshalleseMenomineeMexicanMexican American IndianMongolianMoroccanNative HawaiianNavajoNepaleseNew ZealanderNicaraguanNigerianNorthern EuropeanNorwegianOkinawanOsageOttawaPaiutePakistaniPalestinianPanamanianParaguayanPennsylvania GermanPeruvianPimaPolishPortuguesePotawatomiPuebloPuerto RicanPuget Sound SalishRomanianRussianSalvadoranSamoanScandinavianScotch-IrishScottishSeminoleSenegaleseSerbianShoshoneSierra LeoneanSiouxSlavicSlovakSloveneSomaliSouth AfricanSouth AmericanSouth American IndianSoviet UnionSpaniardSpanishSpanish AmericanSpanish American IndianSri LankanSubsaharan AfricanSudaneseSwedishSyrianTaiwaneseThaiTlingit-HaidaTohono O'OdhamTonganTrinidadian and TobagonianTsimshianTurkishU.S. Virgin IslanderUgandanUkrainianUruguayanUteVenezuelanVietnameseWelshWest IndianYakamaYaquiYugoslavianYumanYup'ikZimbabwean
Immigration
NonimmigrantsImmigrantsAfghanistanAfricaAlbaniaArgentinaArmeniaAsiaAustraliaAustriaBahamasBangladeshBarbadosBelarusBelgiumBelizeBoliviaBosnia and HerzegovinaBrazilBulgariaBurma/MyanmarCabo VerdeCambodiaCameroonCanadaCaribbeanCentral AmericaChileChinaColombiaCongoCosta RicaCroatiaCubaCzechoslovakiaDenmarkDominicaDominican RepublicEastern AfricaEastern AsiaEastern EuropeEcuadorEgyptEl SalvadorEnglandEritreaEthiopiaEuropeFijiFranceGermanyGhanaGreeceGrenadaGuatemalaGuyanaHaitiHondurasHong KongHungaryIndiaIndonesiaIranIraqIrelandIsraelItalyJamaicaJapanJordanKazakhstanKenyaKoreaKuwaitLaosLatin AmericaLatviaLebanonLiberiaLithuaniaMalaysiaMexicoMicronesiaMiddle AfricaMoldovaMoroccoNepalNetherlandsNicaraguaNigeriaNorth AmericaNorth MacedoniaNorthern AfricaNorthern EuropeNorwayOceaniaPakistanPanamaPeruPhilippinesPolandPortugalRomaniaRussiaSaudi ArabiaScotlandSenegalSerbiaSierra LeoneSingaporeSomaliaSouth AfricaSouth AmericaSouth Central AsiaSouth Eastern AsiaSouthern EuropeSpainSri LankaSt. Vincent and the GrenadinesSudanSwedenSwitzerlandSyriaTaiwanThailandTrinidad and TobagoTurkeyUgandaUkraineUruguayUzbekistanVenezuelaVietnamWest IndiesWestern AfricaWestern AsiaWestern EuropeYemenZaireZimbabweAzores
Married-Couple Family Poverty
Income
Poverty
Unemployment
Labor Participation
Family Structure
Vehicle Availability
Education Level
Disability

Swiss Married-Couple Family Poverty
Exceptional

4.3%
POVERTY | MARRIED-COUPLE FAMILIES
99.8/ 100
METRIC RATING
43rd/ 347
METRIC RANK

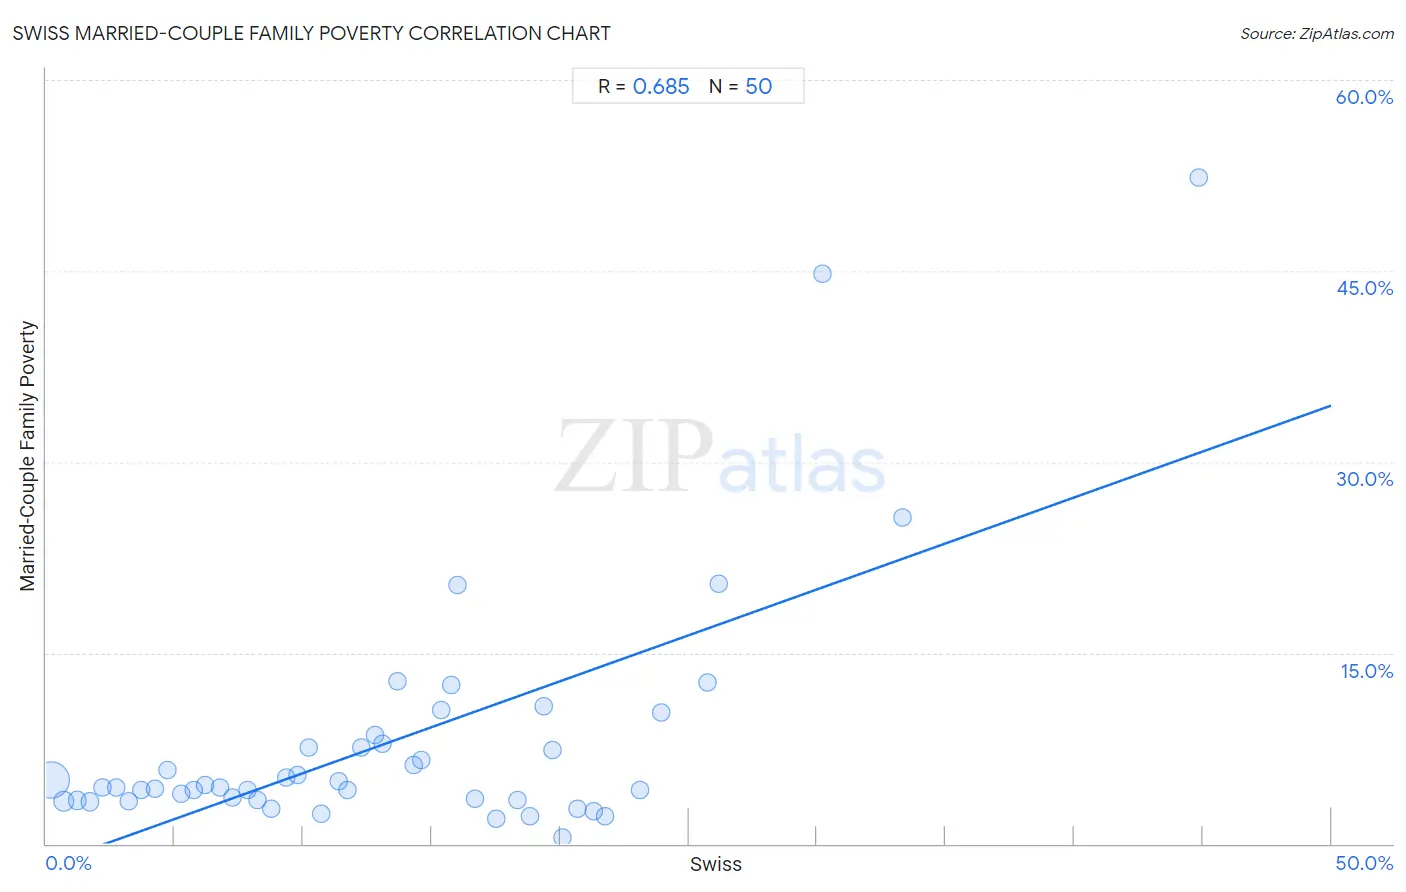
Swiss Married-Couple Family Poverty Correlation Chart

The statistical analysis conducted on geographies consisting of 457,863,093 people shows a significant positive correlation between the proportion of Swiss and poverty level among married-couple families in the United States with a correlation coefficient (R) of 0.685 and weighted average of 4.3%. On average, for every 1% (one percent) increase in Swiss within a typical geography, there is an increase of 0.72% in poverty level among married-couple families.
Swiss Married-Couple Family Poverty
It is essential to understand that the correlation between the percentage of Swiss and poverty level among married-couple families does not imply a direct cause-and-effect relationship. It remains uncertain whether the presence of Swiss influences an upward or downward trend in the level of poverty level among married-couple families within an area, or if Swiss simply ended up residing in those areas with higher or lower levels of poverty level among married-couple families due to other factors.

Demographics Similar to Swiss by Married-Couple Family Poverty

In terms of married-couple family poverty, the demographic groups most similar to Swiss are Immigrants from Japan (4.3%, a difference of 0.38%), Serbian (4.3%, a difference of 0.39%), British (4.3%, a difference of 0.42%), Scottish (4.3%, a difference of 0.44%), and Immigrants from South Central Asia (4.3%, a difference of 0.54%).
DemographicsRating | RankMarried-Couple Family Poverty
English
99.9
/100
|
#36
Exceptional
4.2%
Iranians
99.9
/100
|
#37
Exceptional
4.2%
Belgians
99.9
/100
|
#38
Exceptional
4.2%
Immigrants from Northern Europe
99.8
/100
|
#39
Exceptional
4.2%
French Canadians
99.8
/100
|
#40
Exceptional
4.2%
Northern Europeans
99.8
/100
|
#41
Exceptional
4.3%
Scottish
99.8
/100
|
#42
Exceptional
4.3%
Swiss
99.8
/100
|
#43
Exceptional
4.3%
Immigrants from Japan
99.8
/100
|
#44
Exceptional
4.3%
Serbians
99.8
/100
|
#45
Exceptional
4.3%
British
99.8
/100
|
#46
Exceptional
4.3%
Immigrants from South Central Asia
99.8
/100
|
#47
Exceptional
4.3%
Australians
99.7
/100
|
#48
Exceptional
4.3%
Turks
99.7
/100
|
#49
Exceptional
4.3%
Burmese
99.7
/100
|
#50
Exceptional
4.3%

Swiss Married-Couple Family Poverty Correlation Summary

MeasurementSwiss DataMarried-Couple Family Poverty Data
Minimum0.18%0.49%
Maximum44.8%52.4%
Range44.7%51.9%
Mean13.5%8.1%
Median12.5%4.4%
Interquartile 25% (IQ1)6.2%3.4%
Interquartile 75% (IQ3)19.4%7.8%
Interquartile Range (IQR)13.2%4.4%
Standard Deviation (Sample)9.3%9.8%
Standard Deviation (Population)9.2%9.7%

Correlation Details

Swiss PercentileSample SizeMarried-Couple Family Poverty
[
0.0%
-
0.5%
]
0.18%
389,466,5865.0%
[
0.5%
-
1.0%
]
0.68%
50,128,9933.3%
[
1.0%
-
1.5%
]
1.21%
10,065,9443.4%
[
1.5%
-
2.0%
]
1.70%
3,425,0603.3%
[
2.0%
-
2.5%
]
2.19%
1,514,6604.4%
[
2.5%
-
3.0%
]
2.72%
1,043,0744.4%
[
3.0%
-
3.5%
]
3.20%
581,8003.3%
[
3.5%
-
4.0%
]
3.72%
376,6874.2%
[
4.0%
-
4.5%
]
4.24%
203,1244.3%
[
4.5%
-
5.0%
]
4.74%
173,2675.7%
[
5.0%
-
5.5%
]
5.25%
116,0063.9%
[
5.5%
-
6.0%
]
5.73%
160,7174.2%
[
6.0%
-
6.5%
]
6.20%
115,5534.6%
[
6.5%
-
7.0%
]
6.75%
54,7544.4%
[
7.0%
-
7.5%
]
7.26%
102,7653.7%
[
7.5%
-
8.0%
]
7.82%
21,6214.2%
[
8.0%
-
8.5%
]
8.22%
35,6073.5%
[
8.5%
-
9.0%
]
8.74%
31,9252.7%
[
9.0%
-
9.5%
]
9.35%
37,4595.2%
[
9.5%
-
10.0%
]
9.76%
22,7155.4%
[
10.0%
-
10.5%
]
10.23%
6,8747.5%
[
10.5%
-
11.0%
]
10.70%
33,9302.4%
[
11.0%
-
11.5%
]
11.39%
17,8794.9%
[
11.5%
-
12.0%
]
11.72%
8,4034.2%
[
12.0%
-
12.5%
]
12.26%
10,7587.5%
[
12.5%
-
13.0%
]
12.78%
8,6168.6%
[
13.0%
-
13.5%
]
13.10%
7,8527.8%
[
13.5%
-
14.0%
]
13.68%
56312.8%
[
14.0%
-
14.5%
]
14.30%
5,8406.2%
[
14.5%
-
15.0%
]
14.60%
8,4446.6%
[
15.0%
-
15.5%
]
15.37%
6,85610.5%
[
15.5%
-
16.0%
]
15.77%
70412.5%
[
16.0%
-
16.5%
]
16.02%
76820.3%
[
16.5%
-
17.0%
]
16.67%
8,6273.5%
[
17.5%
-
18.0%
]
17.51%
2,3982.0%
[
18.0%
-
18.5%
]
18.36%
12,7433.4%
[
18.5%
-
19.0%
]
18.82%
15,3362.1%
[
19.0%
-
19.5%
]
19.36%
1,88510.8%
[
19.5%
-
20.0%
]
19.68%
10,4357.4%
[
20.0%
-
20.5%
]
20.08%
4,3030.49%
[
20.5%
-
21.0%
]
20.68%
1,0012.8%
[
21.0%
-
21.5%
]
21.30%
7842.5%
[
21.5%
-
22.0%
]
21.76%
3,4382.1%
[
23.0%
-
23.5%
]
23.12%
1,5144.2%
[
23.5%
-
24.0%
]
23.91%
2,15410.3%
[
25.5%
-
26.0%
]
25.71%
1,58712.6%
[
26.0%
-
26.5%
]
26.17%
38620.4%
[
30.0%
-
30.5%
]
30.19%
36144.8%
[
33.0%
-
33.5%
]
33.33%
27925.6%
[
44.5%
-
45.0%
]
44.83%
5852.4%