Spanish American Married-couple Households
COMPARE
Spanish American
Select to Compare
Married-couple Households
Spanish American Married-couple Households
44.5%
MARRIED-COUPLE HOUSEHOLDS
1.1/ 100
METRIC RATING
239th/ 347
METRIC RANK
Spanish American Married-couple Households Correlation Chart
The statistical analysis conducted on geographies consisting of 103,168,336 people shows a mild positive correlation between the proportion of Spanish Americans and percentage of married-couple family households in the United States with a correlation coefficient (R) of 0.395 and weighted average of 44.5%. On average, for every 1% (one percent) increase in Spanish Americans within a typical geography, there is an increase of 0.43% in percentage of married-couple family households.
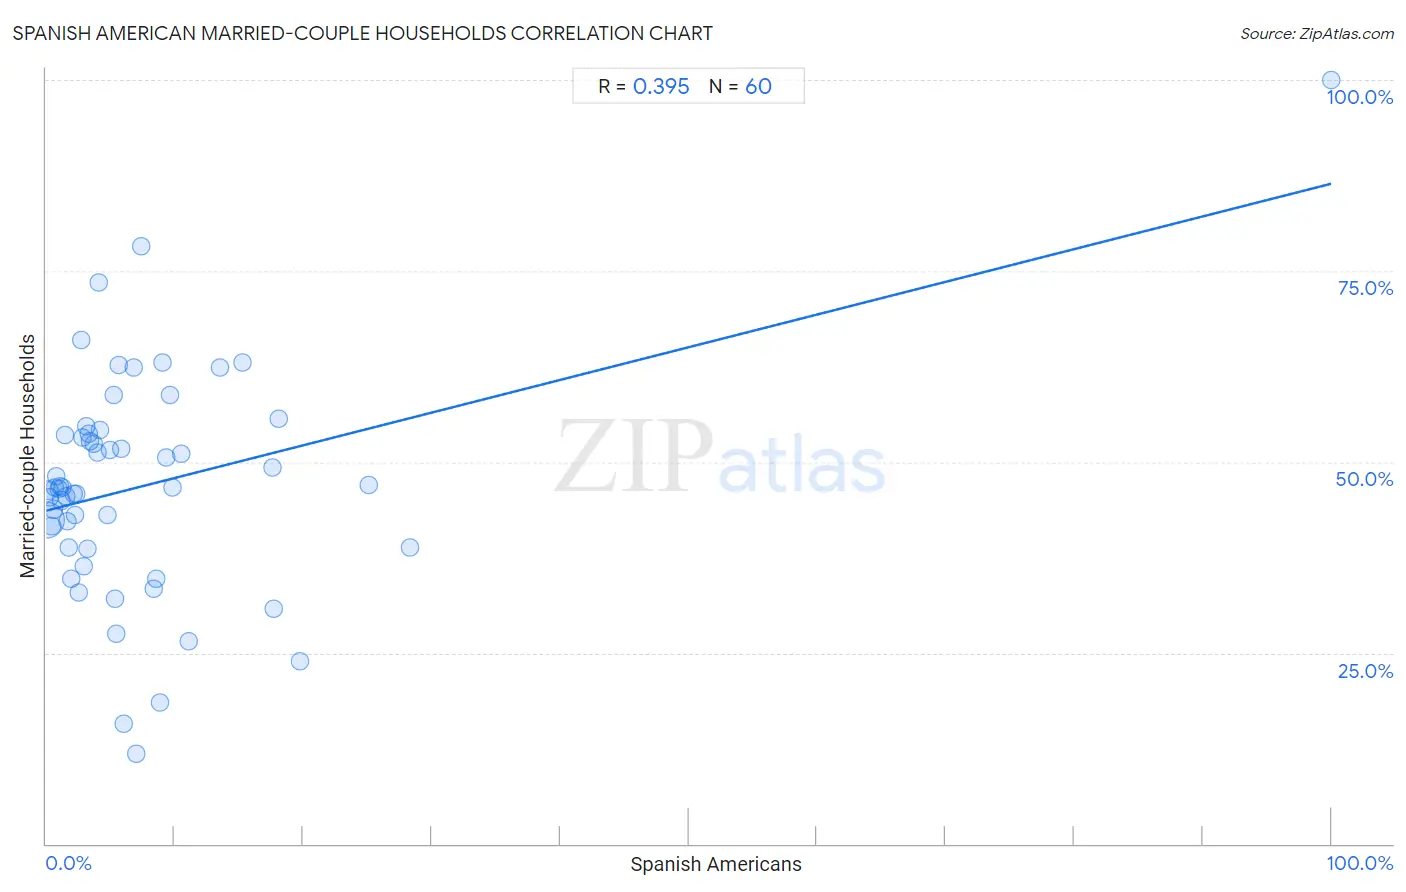
It is essential to understand that the correlation between the percentage of Spanish Americans and percentage of married-couple family households does not imply a direct cause-and-effect relationship. It remains uncertain whether the presence of Spanish Americans influences an upward or downward trend in the level of percentage of married-couple family households within an area, or if Spanish Americans simply ended up residing in those areas with higher or lower levels of percentage of married-couple family households due to other factors.
Demographics Similar to Spanish Americans by Married-couple Households
In terms of married-couple households, the demographic groups most similar to Spanish Americans are Immigrants from Uruguay (44.5%, a difference of 0.020%), Comanche (44.5%, a difference of 0.070%), Ute (44.4%, a difference of 0.080%), Immigrants from Bosnia and Herzegovina (44.4%, a difference of 0.080%), and Immigrants from Nicaragua (44.5%, a difference of 0.10%).
| Demographics | Rating | Rank | Married-couple Households |
| Marshallese | 1.5 /100 | #232 | Tragic 44.6% |
| Immigrants from Uganda | 1.5 /100 | #233 | Tragic 44.6% |
| Immigrants from Panama | 1.3 /100 | #234 | Tragic 44.6% |
| Immigrants from Nicaragua | 1.2 /100 | #235 | Tragic 44.5% |
| Yaqui | 1.2 /100 | #236 | Tragic 44.5% |
| Comanche | 1.2 /100 | #237 | Tragic 44.5% |
| Immigrants from Uruguay | 1.1 /100 | #238 | Tragic 44.5% |
| Spanish Americans | 1.1 /100 | #239 | Tragic 44.5% |
| Ute | 1.0 /100 | #240 | Tragic 44.4% |
| Immigrants from Bosnia and Herzegovina | 1.0 /100 | #241 | Tragic 44.4% |
| Immigrants from Albania | 1.0 /100 | #242 | Tragic 44.4% |
| Immigrants from Saudi Arabia | 0.9 /100 | #243 | Tragic 44.4% |
| Immigrants from Armenia | 0.7 /100 | #244 | Tragic 44.3% |
| Immigrants from El Salvador | 0.7 /100 | #245 | Tragic 44.3% |
| Immigrants from Cuba | 0.6 /100 | #246 | Tragic 44.2% |
Spanish American Married-couple Households Correlation Summary
| Measurement | Spanish American Data | Married-couple Households Data |
| Minimum | 0.023% | 11.8% |
| Maximum | 100.0% | 100.0% |
| Range | 100.0% | 88.2% |
| Mean | 7.8% | 46.9% |
| Median | 4.1% | 46.6% |
| Interquartile 25% (IQ1) | 1.9% | 38.8% |
| Interquartile 75% (IQ3) | 9.0% | 53.6% |
| Interquartile Range (IQR) | 7.1% | 14.9% |
| Standard Deviation (Sample) | 13.6% | 14.7% |
| Standard Deviation (Population) | 13.5% | 14.6% |
Correlation Details
| Spanish American Percentile | Sample Size | Married-couple Households |
[ 0.0% - 0.5% ] 0.023% | 92,626,671 | 42.3% |
[ 0.0% - 0.5% ] 0.17% | 5,518,927 | 46.3% |
[ 0.0% - 0.5% ] 0.31% | 1,685,599 | 45.3% |
[ 0.0% - 0.5% ] 0.44% | 1,672,122 | 41.6% |
[ 0.5% - 1.0% ] 0.55% | 466,216 | 43.8% |
[ 0.5% - 1.0% ] 0.68% | 294,802 | 46.7% |
[ 0.5% - 1.0% ] 0.80% | 228,370 | 48.1% |
[ 0.5% - 1.0% ] 0.95% | 73,627 | 46.6% |
[ 1.0% - 1.5% ] 1.05% | 169,772 | 46.9% |
[ 1.0% - 1.5% ] 1.21% | 110,379 | 44.9% |
[ 1.0% - 1.5% ] 1.31% | 45,172 | 46.6% |
[ 1.0% - 1.5% ] 1.43% | 63,242 | 53.6% |
[ 1.5% - 2.0% ] 1.59% | 38,705 | 45.5% |
[ 1.5% - 2.0% ] 1.69% | 11,418 | 42.2% |
[ 1.5% - 2.0% ] 1.78% | 25,218 | 38.8% |
[ 1.5% - 2.0% ] 1.94% | 2,266 | 34.7% |
[ 2.0% - 2.5% ] 2.09% | 13,673 | 45.8% |
[ 2.0% - 2.5% ] 2.21% | 16,174 | 43.0% |
[ 2.0% - 2.5% ] 2.32% | 11,056 | 45.8% |
[ 2.5% - 3.0% ] 2.58% | 9,165 | 33.0% |
[ 2.5% - 3.0% ] 2.75% | 1,019 | 66.0% |
[ 2.5% - 3.0% ] 2.82% | 8,083 | 53.2% |
[ 2.5% - 3.0% ] 2.96% | 5,571 | 36.4% |
[ 3.0% - 3.5% ] 3.11% | 7,203 | 54.7% |
[ 3.0% - 3.5% ] 3.16% | 411 | 38.6% |
[ 3.0% - 3.5% ] 3.29% | 4,136 | 53.7% |
[ 3.0% - 3.5% ] 3.44% | 6,781 | 52.6% |
[ 3.5% - 4.0% ] 3.69% | 461 | 52.3% |
[ 3.5% - 4.0% ] 3.98% | 3,818 | 51.2% |
[ 4.0% - 4.5% ] 4.05% | 4,347 | 73.4% |
[ 4.0% - 4.5% ] 4.20% | 1,953 | 54.2% |
[ 4.5% - 5.0% ] 4.73% | 2,496 | 43.1% |
[ 4.5% - 5.0% ] 4.99% | 2,344 | 51.5% |
[ 5.0% - 5.5% ] 5.21% | 2,398 | 58.8% |
[ 5.0% - 5.5% ] 5.33% | 1,501 | 32.1% |
[ 5.0% - 5.5% ] 5.42% | 4,224 | 27.4% |
[ 5.5% - 6.0% ] 5.65% | 2,955 | 62.7% |
[ 5.5% - 6.0% ] 5.86% | 5,156 | 51.7% |
[ 6.0% - 6.5% ] 6.08% | 971 | 15.8% |
[ 6.5% - 7.0% ] 6.84% | 3,217 | 62.3% |
[ 6.5% - 7.0% ] 6.98% | 516 | 11.8% |
[ 7.0% - 7.5% ] 7.39% | 1,381 | 78.3% |
[ 8.0% - 8.5% ] 8.33% | 24 | 33.3% |
[ 8.5% - 9.0% ] 8.54% | 984 | 34.6% |
[ 8.5% - 9.0% ] 8.83% | 634 | 18.5% |
[ 9.0% - 9.5% ] 9.09% | 2,806 | 63.0% |
[ 9.0% - 9.5% ] 9.33% | 2,445 | 50.6% |
[ 9.5% - 10.0% ] 9.65% | 228 | 58.8% |
[ 9.5% - 10.0% ] 9.83% | 356 | 46.6% |
[ 10.0% - 10.5% ] 10.46% | 2,179 | 51.0% |
[ 11.0% - 11.5% ] 11.06% | 235 | 26.4% |
[ 13.5% - 14.0% ] 13.52% | 281 | 62.3% |
[ 15.0% - 15.5% ] 15.23% | 1,504 | 63.0% |
[ 17.5% - 18.0% ] 17.56% | 427 | 49.2% |
[ 17.5% - 18.0% ] 17.72% | 79 | 30.8% |
[ 18.0% - 18.5% ] 18.12% | 320 | 55.6% |
[ 19.5% - 20.0% ] 19.79% | 1,950 | 23.8% |
[ 25.0% - 25.5% ] 25.12% | 211 | 47.0% |
[ 28.0% - 28.5% ] 28.35% | 127 | 38.8% |
[ 99.5% - 100.0% ] 100.00% | 30 | 100.0% |