Nepalese Married-couple Households

COMPARE

Nepalese
Race
Ancestry
AfghanAfricanAlaska NativeAlaskan AthabascanAlbanianAleutAlsatianAmericanApacheArabArapahoArgentineanArmenianAssyrian/Chaldean/SyriacAustralianAustrianBahamianBangladeshiBarbadianBasqueBelgianBelizeanBermudanBhutaneseBlackfeetBolivianBrazilianBritishBritish West IndianBulgarianBurmeseCajunCambodianCanadianCape VerdeanCarpatho RusynCelticCentral AmericanCentral American IndianCherokeeCheyenneChickasawChileanChineseChippewaChoctawColombianColvilleComancheCosta RicanCreeCreekCroatianCrowCubanCypriotCzechCzechoslovakianDanishDelawareDominicanDutchDutch West IndianEastern EuropeanEcuadorianEgyptianEnglishEstonianEthiopianEuropeanFijianFilipinoFinnishFrenchFrench American IndianFrench CanadianGermanGerman RussianGhanaianGreekGuamanian/ChamorroGuatemalanGuyaneseHaitianHmongHonduranHopiHoumaHungarianIcelanderIndian (Asian)IndonesianInupiatIranianIraqiIrishIroquoisIsraeliItalianJamaicanJapaneseJordanianKenyanKiowaKoreanLaotianLatvianLebaneseLiberianLithuanianLumbeeLuxembourgerMacedonianMalaysianMalteseMarshalleseMenomineeMexicanMexican American IndianMongolianMoroccanNative HawaiianNavajoNepaleseNew ZealanderNicaraguanNigerianNorthern EuropeanNorwegianOkinawanOsageOttawaPaiutePakistaniPalestinianPanamanianParaguayanPennsylvania GermanPeruvianPimaPolishPortuguesePotawatomiPuebloPuerto RicanPuget Sound SalishRomanianRussianSalvadoranSamoanScandinavianScotch-IrishScottishSeminoleSenegaleseSerbianShoshoneSierra LeoneanSiouxSlavicSlovakSloveneSomaliSouth AfricanSouth AmericanSouth American IndianSoviet UnionSpaniardSpanishSpanish AmericanSpanish American IndianSri LankanSubsaharan AfricanSudaneseSwedishSwissSyrianTaiwaneseThaiTlingit-HaidaTohono O'OdhamTonganTrinidadian and TobagonianTsimshianTurkishU.S. Virgin IslanderUgandanUkrainianUruguayanUteVenezuelanVietnameseWelshWest IndianYakamaYaquiYugoslavianYumanYup'ikZimbabwean
Immigration
NonimmigrantsImmigrantsAfghanistanAfricaAlbaniaArgentinaArmeniaAsiaAustraliaAustriaBahamasBangladeshBarbadosBelarusBelgiumBelizeBoliviaBosnia and HerzegovinaBrazilBulgariaBurma/MyanmarCabo VerdeCambodiaCameroonCanadaCaribbeanCentral AmericaChileChinaColombiaCongoCosta RicaCroatiaCubaCzechoslovakiaDenmarkDominicaDominican RepublicEastern AfricaEastern AsiaEastern EuropeEcuadorEgyptEl SalvadorEnglandEritreaEthiopiaEuropeFijiFranceGermanyGhanaGreeceGrenadaGuatemalaGuyanaHaitiHondurasHong KongHungaryIndiaIndonesiaIranIraqIrelandIsraelItalyJamaicaJapanJordanKazakhstanKenyaKoreaKuwaitLaosLatin AmericaLatviaLebanonLiberiaLithuaniaMalaysiaMexicoMicronesiaMiddle AfricaMoldovaMoroccoNepalNetherlandsNicaraguaNigeriaNorth AmericaNorth MacedoniaNorthern AfricaNorthern EuropeNorwayOceaniaPakistanPanamaPeruPhilippinesPolandPortugalRomaniaRussiaSaudi ArabiaScotlandSenegalSerbiaSierra LeoneSingaporeSomaliaSouth AfricaSouth AmericaSouth Central AsiaSouth Eastern AsiaSouthern EuropeSpainSri LankaSt. Vincent and the GrenadinesSudanSwedenSwitzerlandSyriaTaiwanThailandTrinidad and TobagoTurkeyUgandaUkraineUruguayUzbekistanVenezuelaVietnamWest IndiesWestern AfricaWestern AsiaWestern EuropeYemenZaireZimbabweAzores
Select to Compare
Race
Ancestry
AfghanAfricanAlaska NativeAlaskan AthabascanAlbanianAleutAlsatianAmericanApacheArabArapahoArgentineanArmenianAssyrian/Chaldean/SyriacAustralianAustrianBahamianBangladeshiBarbadianBasqueBelgianBelizeanBermudanBhutaneseBlackfeetBolivianBrazilianBritishBritish West IndianBulgarianBurmeseCajunCambodianCanadianCape VerdeanCarpatho RusynCelticCentral AmericanCentral American IndianCherokeeCheyenneChickasawChileanChineseChippewaChoctawColombianColvilleComancheCosta RicanCreeCreekCroatianCrowCubanCypriotCzechCzechoslovakianDanishDelawareDominicanDutchDutch West IndianEastern EuropeanEcuadorianEgyptianEnglishEstonianEthiopianEuropeanFijianFilipinoFinnishFrenchFrench American IndianFrench CanadianGermanGerman RussianGhanaianGreekGuamanian/ChamorroGuatemalanGuyaneseHaitianHmongHonduranHopiHoumaHungarianIcelanderIndian (Asian)IndonesianInupiatIranianIraqiIrishIroquoisIsraeliItalianJamaicanJapaneseJordanianKenyanKiowaKoreanLaotianLatvianLebaneseLiberianLithuanianLumbeeLuxembourgerMacedonianMalaysianMalteseMarshalleseMenomineeMexicanMexican American IndianMongolianMoroccanNative HawaiianNavajoNew ZealanderNicaraguanNigerianNorthern EuropeanNorwegianOkinawanOsageOttawaPaiutePakistaniPalestinianPanamanianParaguayanPennsylvania GermanPeruvianPimaPolishPortuguesePotawatomiPuebloPuerto RicanPuget Sound SalishRomanianRussianSalvadoranSamoanScandinavianScotch-IrishScottishSeminoleSenegaleseSerbianShoshoneSierra LeoneanSiouxSlavicSlovakSloveneSomaliSouth AfricanSouth AmericanSouth American IndianSoviet UnionSpaniardSpanishSpanish AmericanSpanish American IndianSri LankanSubsaharan AfricanSudaneseSwedishSwissSyrianTaiwaneseThaiTlingit-HaidaTohono O'OdhamTonganTrinidadian and TobagonianTsimshianTurkishU.S. Virgin IslanderUgandanUkrainianUruguayanUteVenezuelanVietnameseWelshWest IndianYakamaYaquiYugoslavianYumanYup'ikZimbabwean
Immigration
NonimmigrantsImmigrantsAfghanistanAfricaAlbaniaArgentinaArmeniaAsiaAustraliaAustriaBahamasBangladeshBarbadosBelarusBelgiumBelizeBoliviaBosnia and HerzegovinaBrazilBulgariaBurma/MyanmarCabo VerdeCambodiaCameroonCanadaCaribbeanCentral AmericaChileChinaColombiaCongoCosta RicaCroatiaCubaCzechoslovakiaDenmarkDominicaDominican RepublicEastern AfricaEastern AsiaEastern EuropeEcuadorEgyptEl SalvadorEnglandEritreaEthiopiaEuropeFijiFranceGermanyGhanaGreeceGrenadaGuatemalaGuyanaHaitiHondurasHong KongHungaryIndiaIndonesiaIranIraqIrelandIsraelItalyJamaicaJapanJordanKazakhstanKenyaKoreaKuwaitLaosLatin AmericaLatviaLebanonLiberiaLithuaniaMalaysiaMexicoMicronesiaMiddle AfricaMoldovaMoroccoNepalNetherlandsNicaraguaNigeriaNorth AmericaNorth MacedoniaNorthern AfricaNorthern EuropeNorwayOceaniaPakistanPanamaPeruPhilippinesPolandPortugalRomaniaRussiaSaudi ArabiaScotlandSenegalSerbiaSierra LeoneSingaporeSomaliaSouth AfricaSouth AmericaSouth Central AsiaSouth Eastern AsiaSouthern EuropeSpainSri LankaSt. Vincent and the GrenadinesSudanSwedenSwitzerlandSyriaTaiwanThailandTrinidad and TobagoTurkeyUgandaUkraineUruguayUzbekistanVenezuelaVietnamWest IndiesWestern AfricaWestern AsiaWestern EuropeYemenZaireZimbabweAzores
Married-couple Households
Income
Poverty
Unemployment
Labor Participation
Family Structure
Vehicle Availability
Education Level
Disability

Nepalese Married-couple Households
Poor

45.6%
MARRIED-COUPLE HOUSEHOLDS
11.9/ 100
METRIC RATING
205th/ 347
METRIC RANK

Nepalese Married-couple Households Correlation Chart

The statistical analysis conducted on geographies consisting of 24,521,755 people shows a poor negative correlation between the proportion of Nepalese and percentage of married-couple family households in the United States with a correlation coefficient (R) of -0.126 and weighted average of 45.6%. On average, for every 1% (one percent) increase in Nepalese within a typical geography, there is a decrease of 0.58% in percentage of married-couple family households.
Nepalese Married-couple Households
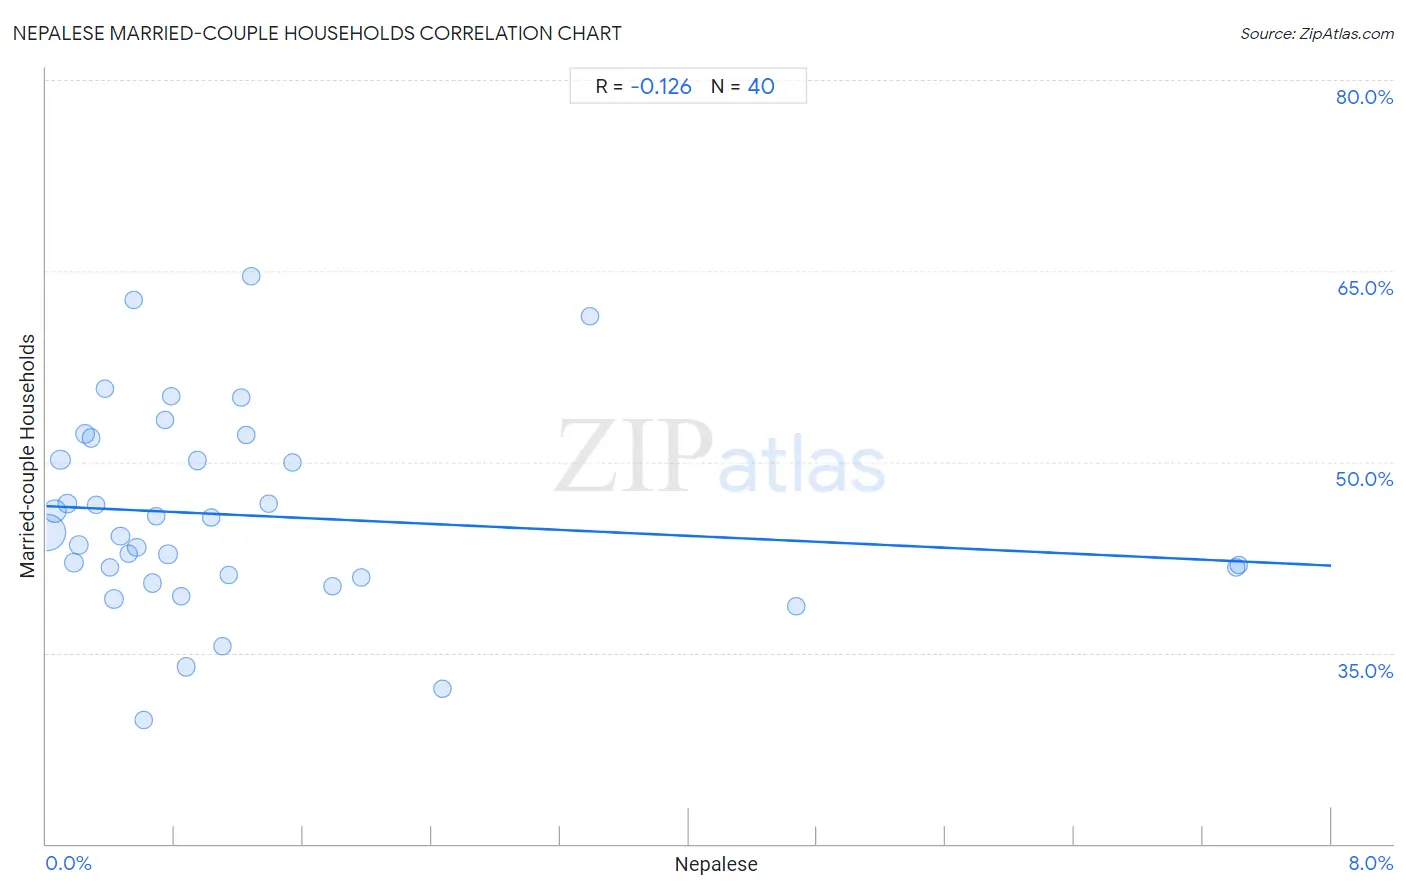
It is essential to understand that the correlation between the percentage of Nepalese and percentage of married-couple family households does not imply a direct cause-and-effect relationship. It remains uncertain whether the presence of Nepalese influences an upward or downward trend in the level of percentage of married-couple family households within an area, or if Nepalese simply ended up residing in those areas with higher or lower levels of percentage of married-couple family households due to other factors.

Demographics Similar to Nepalese by Married-couple Households

In terms of married-couple households, the demographic groups most similar to Nepalese are Aleut (45.6%, a difference of 0.050%), Alaska Native (45.6%, a difference of 0.10%), Uruguayan (45.5%, a difference of 0.14%), Immigrants from Central America (45.7%, a difference of 0.19%), and Immigrants from Serbia (45.7%, a difference of 0.27%).
DemographicsRating | RankMarried-couple Households
Ottawa
19.4
/100
|
#198
Poor
45.8%
Carpatho Rusyns
15.7
/100
|
#199
Poor
45.7%
Potawatomi
15.6
/100
|
#200
Poor
45.7%
Immigrants from Serbia
15.2
/100
|
#201
Poor
45.7%
Immigrants from Central America
14.2
/100
|
#202
Poor
45.7%
Alaska Natives
13.0
/100
|
#203
Poor
45.6%
Aleuts
12.5
/100
|
#204
Poor
45.6%
Nepalese
11.9
/100
|
#205
Poor
45.6%
Uruguayans
10.4
/100
|
#206
Poor
45.5%
Immigrants from France
8.8
/100
|
#207
Tragic
45.4%
Hispanics or Latinos
8.7
/100
|
#208
Tragic
45.4%
Immigrants from Uzbekistan
8.4
/100
|
#209
Tragic
45.4%
Cubans
7.7
/100
|
#210
Tragic
45.4%
Immigrants from Spain
7.3
/100
|
#211
Tragic
45.3%
Creek
6.4
/100
|
#212
Tragic
45.3%

Nepalese Married-couple Households Correlation Summary

MeasurementNepalese DataMarried-couple Households Data
Minimum0.0096%29.7%
Maximum7.4%64.6%
Range7.4%34.9%
Mean1.3%45.8%
Median0.75%44.3%
Interquartile 25% (IQ1)0.38%41.0%
Interquartile 75% (IQ3)1.3%51.0%
Interquartile Range (IQR)0.88%10.0%
Standard Deviation (Sample)1.7%7.9%
Standard Deviation (Population)1.7%7.8%

Correlation Details

Nepalese PercentileSample SizeMarried-couple Households
[
0.0%
-
0.5%
]
0.0096%
13,361,71544.4%
[
0.0%
-
0.5%
]
0.054%
3,796,80746.1%
[
0.0%
-
0.5%
]
0.089%
1,243,19250.2%
[
0.0%
-
0.5%
]
0.13%
1,098,83846.7%
[
0.0%
-
0.5%
]
0.17%
641,38242.1%
[
0.0%
-
0.5%
]
0.21%
853,16843.5%
[
0.0%
-
0.5%
]
0.24%
759,59752.2%
[
0.0%
-
0.5%
]
0.28%
277,68251.9%
[
0.0%
-
0.5%
]
0.31%
230,77846.6%
[
0.0%
-
0.5%
]
0.36%
142,78255.8%
[
0.0%
-
0.5%
]
0.40%
123,26841.7%
[
0.0%
-
0.5%
]
0.42%
568,34239.2%
[
0.0%
-
0.5%
]
0.46%
197,87344.1%
[
0.5%
-
1.0%
]
0.51%
111,35942.8%
[
0.5%
-
1.0%
]
0.54%
87,44162.7%
[
0.5%
-
1.0%
]
0.56%
189,40743.3%
[
0.5%
-
1.0%
]
0.60%
38,45929.7%
[
0.5%
-
1.0%
]
0.66%
91,35940.5%
[
0.5%
-
1.0%
]
0.69%
60,85045.7%
[
0.5%
-
1.0%
]
0.74%
22,14553.3%
[
0.5%
-
1.0%
]
0.76%
120,70142.7%
[
0.5%
-
1.0%
]
0.78%
16,15055.1%
[
0.5%
-
1.0%
]
0.84%
56,65039.4%
[
0.5%
-
1.0%
]
0.87%
57,94333.9%
[
0.5%
-
1.0%
]
0.94%
118,10550.1%
[
1.0%
-
1.5%
]
1.03%
7,58145.6%
[
1.0%
-
1.5%
]
1.10%
20,83535.6%
[
1.0%
-
1.5%
]
1.13%
41,31141.1%
[
1.0%
-
1.5%
]
1.21%
5,20255.1%
[
1.0%
-
1.5%
]
1.25%
2,48652.1%
[
1.0%
-
1.5%
]
1.28%
33,11664.6%
[
1.0%
-
1.5%
]
1.38%
80,54346.7%
[
1.5%
-
2.0%
]
1.53%
10,90249.9%
[
1.5%
-
2.0%
]
1.78%
14,82440.2%
[
1.5%
-
2.0%
]
1.96%
30,55640.9%
[
2.0%
-
2.5%
]
2.47%
1,29732.2%
[
3.0%
-
3.5%
]
3.39%
3,95561.5%
[
4.5%
-
5.0%
]
4.67%
2,29138.7%
[
7.0%
-
7.5%
]
7.41%
43241.7%
[
7.0%
-
7.5%
]
7.42%
43141.9%