Nepalese Unemployment Among Women with Children Ages 6 to 17 years
COMPARE
Nepalese
Select to Compare
Unemployment Among Women with Children Ages 6 to 17 years
Nepalese Unemployment Among Women with Children Ages 6 to 17 years
7.7%
UNEMPLOYMENT | WOMEN W/ CHILDREN 6 TO 17
100.0/ 100
METRIC RATING
24th/ 347
METRIC RANK
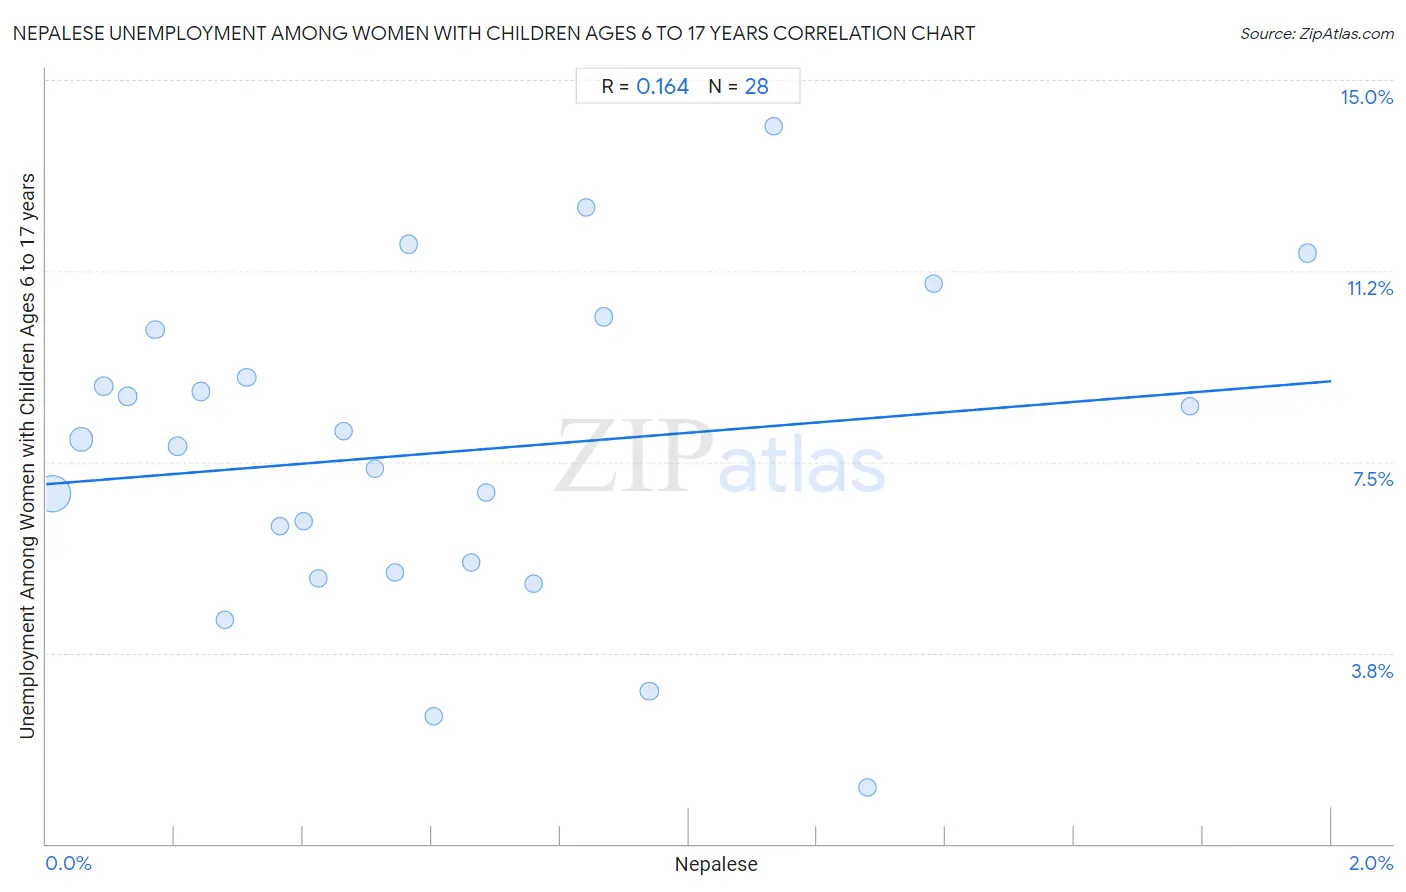
Nepalese Unemployment Among Women with Children Ages 6 to 17 years Correlation Chart
The statistical analysis conducted on geographies consisting of 22,673,047 people shows a poor positive correlation between the proportion of Nepalese and unemployment rate among women with children between the ages 6 and 17 in the United States with a correlation coefficient (R) of 0.164 and weighted average of 7.7%. On average, for every 1% (one percent) increase in Nepalese within a typical geography, there is an increase of 1.0% in unemployment rate among women with children between the ages 6 and 17.
It is essential to understand that the correlation between the percentage of Nepalese and unemployment rate among women with children between the ages 6 and 17 does not imply a direct cause-and-effect relationship. It remains uncertain whether the presence of Nepalese influences an upward or downward trend in the level of unemployment rate among women with children between the ages 6 and 17 within an area, or if Nepalese simply ended up residing in those areas with higher or lower levels of unemployment rate among women with children between the ages 6 and 17 due to other factors.
Demographics Similar to Nepalese by Unemployment Among Women with Children Ages 6 to 17 years
In terms of unemployment among women with children ages 6 to 17 years, the demographic groups most similar to Nepalese are Immigrants from Indonesia (7.7%, a difference of 0.010%), Immigrants from Eastern Asia (7.7%, a difference of 0.12%), Indian (Asian) (7.7%, a difference of 0.13%), Immigrants from China (7.7%, a difference of 0.39%), and Immigrants from India (7.7%, a difference of 0.68%).
| Demographics | Rating | Rank | Unemployment Among Women with Children Ages 6 to 17 years |
| Cambodians | 100.0 /100 | #17 | Exceptional 7.5% |
| Afghans | 100.0 /100 | #18 | Exceptional 7.6% |
| Filipinos | 100.0 /100 | #19 | Exceptional 7.6% |
| Immigrants from Singapore | 100.0 /100 | #20 | Exceptional 7.7% |
| Immigrants from India | 100.0 /100 | #21 | Exceptional 7.7% |
| Immigrants from China | 100.0 /100 | #22 | Exceptional 7.7% |
| Immigrants from Indonesia | 100.0 /100 | #23 | Exceptional 7.7% |
| Nepalese | 100.0 /100 | #24 | Exceptional 7.7% |
| Immigrants from Eastern Asia | 100.0 /100 | #25 | Exceptional 7.7% |
| Indians (Asian) | 100.0 /100 | #26 | Exceptional 7.7% |
| Immigrants from Afghanistan | 100.0 /100 | #27 | Exceptional 7.8% |
| Immigrants from Uzbekistan | 100.0 /100 | #28 | Exceptional 7.8% |
| Thais | 100.0 /100 | #29 | Exceptional 7.8% |
| Immigrants from Iran | 100.0 /100 | #30 | Exceptional 7.9% |
| Laotians | 100.0 /100 | #31 | Exceptional 7.9% |
Nepalese Unemployment Among Women with Children Ages 6 to 17 years Correlation Summary
| Measurement | Nepalese Data | Unemployment Among Women with Children Ages 6 to 17 years Data |
| Minimum | 0.0093% | 1.1% |
| Maximum | 2.0% | 14.1% |
| Range | 2.0% | 13.0% |
| Mean | 0.63% | 7.7% |
| Median | 0.53% | 7.9% |
| Interquartile 25% (IQ1) | 0.26% | 5.4% |
| Interquartile 75% (IQ3) | 0.85% | 9.6% |
| Interquartile Range (IQR) | 0.59% | 4.2% |
| Standard Deviation (Sample) | 0.50% | 3.1% |
| Standard Deviation (Population) | 0.49% | 3.0% |
Correlation Details
| Nepalese Percentile | Sample Size | Unemployment Among Women with Children Ages 6 to 17 years |
[ 0.0% - 0.5% ] 0.0093% | 13,044,057 | 6.9% |
[ 0.0% - 0.5% ] 0.055% | 3,527,521 | 7.9% |
[ 0.0% - 0.5% ] 0.090% | 966,233 | 9.0% |
[ 0.0% - 0.5% ] 0.13% | 785,792 | 8.8% |
[ 0.0% - 0.5% ] 0.17% | 506,197 | 10.1% |
[ 0.0% - 0.5% ] 0.21% | 830,928 | 7.8% |
[ 0.0% - 0.5% ] 0.24% | 558,629 | 8.9% |
[ 0.0% - 0.5% ] 0.28% | 247,456 | 4.4% |
[ 0.0% - 0.5% ] 0.31% | 188,366 | 9.2% |
[ 0.0% - 0.5% ] 0.36% | 112,674 | 6.2% |
[ 0.0% - 0.5% ] 0.40% | 90,143 | 6.3% |
[ 0.0% - 0.5% ] 0.42% | 568,342 | 5.2% |
[ 0.0% - 0.5% ] 0.46% | 183,582 | 8.1% |
[ 0.5% - 1.0% ] 0.51% | 111,359 | 7.4% |
[ 0.5% - 1.0% ] 0.54% | 87,441 | 5.3% |
[ 0.5% - 1.0% ] 0.56% | 189,407 | 11.8% |
[ 0.5% - 1.0% ] 0.60% | 38,459 | 2.5% |
[ 0.5% - 1.0% ] 0.66% | 71,076 | 5.5% |
[ 0.5% - 1.0% ] 0.69% | 60,850 | 6.9% |
[ 0.5% - 1.0% ] 0.76% | 120,701 | 5.1% |
[ 0.5% - 1.0% ] 0.84% | 52,102 | 12.5% |
[ 0.5% - 1.0% ] 0.87% | 47,291 | 10.3% |
[ 0.5% - 1.0% ] 0.94% | 97,278 | 3.0% |
[ 1.0% - 1.5% ] 1.13% | 41,311 | 14.1% |
[ 1.0% - 1.5% ] 1.28% | 31,297 | 1.1% |
[ 1.0% - 1.5% ] 1.38% | 69,175 | 11.0% |
[ 1.5% - 2.0% ] 1.78% | 14,824 | 8.6% |
[ 1.5% - 2.0% ] 1.96% | 30,556 | 11.6% |