Immigrants from Norway 2 or more Vehicles in Household
COMPARE
Immigrants from Norway
Select to Compare
2 or more Vehicles in Household
Immigrants from Norway 2 or more Vehicles in Household
54.4%
2+ VEHICLES AVAILABLE
15.9/ 100
METRIC RATING
199th/ 347
METRIC RANK
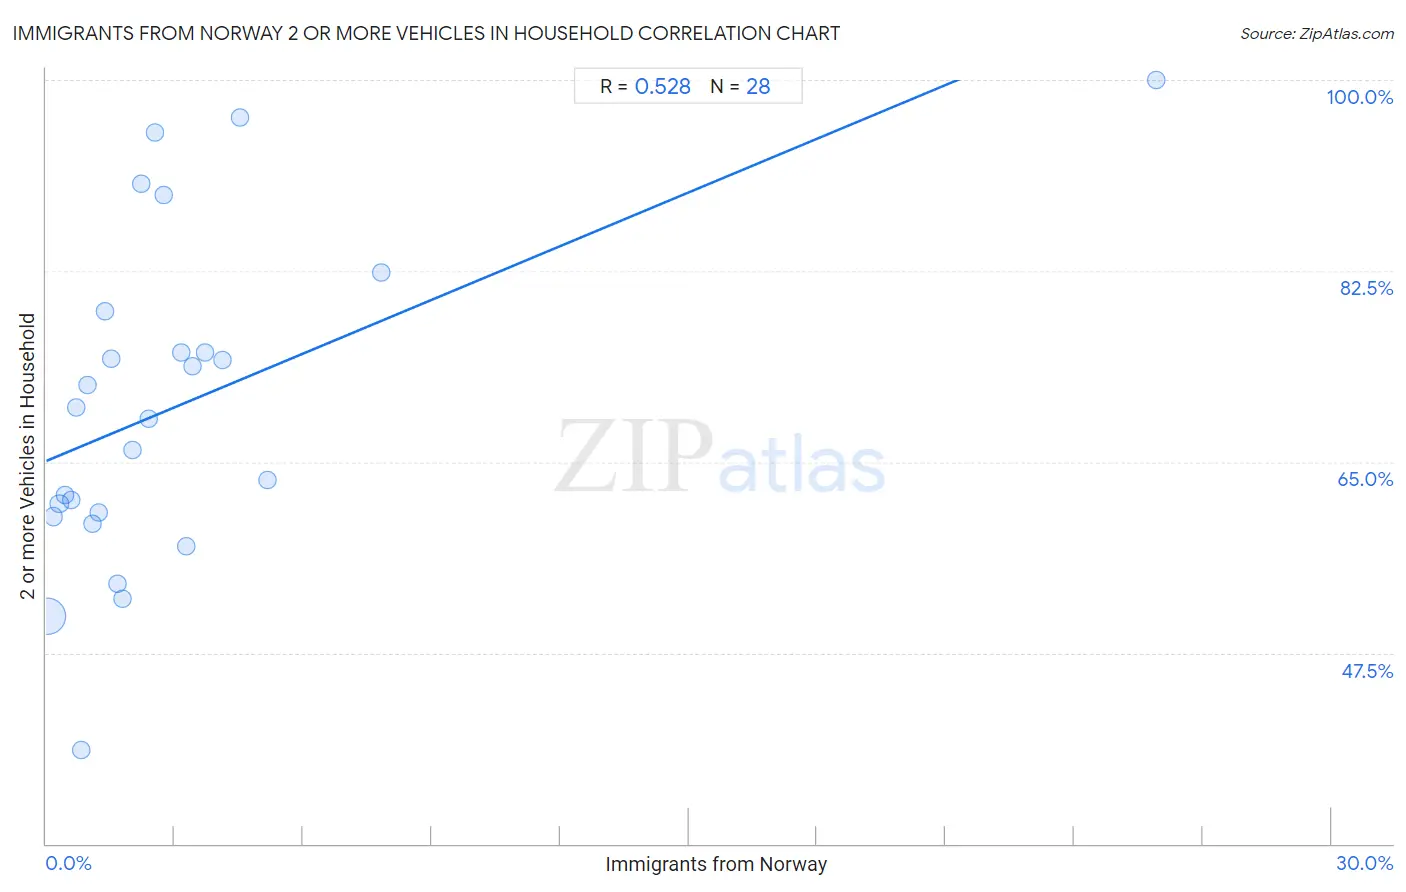
Immigrants from Norway 2 or more Vehicles in Household Correlation Chart
The statistical analysis conducted on geographies consisting of 116,688,411 people shows a substantial positive correlation between the proportion of Immigrants from Norway and percentage of households with 2 or more vehicles available in the United States with a correlation coefficient (R) of 0.528 and weighted average of 54.4%. On average, for every 1% (one percent) increase in Immigrants from Norway within a typical geography, there is an increase of 1.6% in percentage of households with 2 or more vehicles available.
It is essential to understand that the correlation between the percentage of Immigrants from Norway and percentage of households with 2 or more vehicles available does not imply a direct cause-and-effect relationship. It remains uncertain whether the presence of Immigrants from Norway influences an upward or downward trend in the level of percentage of households with 2 or more vehicles available within an area, or if Immigrants from Norway simply ended up residing in those areas with higher or lower levels of percentage of households with 2 or more vehicles available due to other factors.
Demographics Similar to Immigrants from Norway by 2 or more Vehicles in Household
In terms of 2 or more vehicles in household, the demographic groups most similar to Immigrants from Norway are Houma (54.4%, a difference of 0.0%), Carpatho Rusyn (54.4%, a difference of 0.030%), Immigrants from Italy (54.4%, a difference of 0.030%), Immigrants from North Macedonia (54.4%, a difference of 0.080%), and Argentinean (54.5%, a difference of 0.12%).
| Demographics | Rating | Rank | 2 or more Vehicles in Household |
| Immigrants from Romania | 23.8 /100 | #192 | Fair 54.7% |
| Immigrants from Japan | 23.4 /100 | #193 | Fair 54.7% |
| Central Americans | 23.0 /100 | #194 | Fair 54.7% |
| Iroquois | 22.6 /100 | #195 | Fair 54.7% |
| Immigrants from Poland | 19.3 /100 | #196 | Poor 54.6% |
| Argentineans | 17.5 /100 | #197 | Poor 54.5% |
| Carpatho Rusyns | 16.2 /100 | #198 | Poor 54.4% |
| Immigrants from Norway | 15.9 /100 | #199 | Poor 54.4% |
| Houma | 15.8 /100 | #200 | Poor 54.4% |
| Immigrants from Italy | 15.5 /100 | #201 | Poor 54.4% |
| Immigrants from North Macedonia | 14.9 /100 | #202 | Poor 54.4% |
| Immigrants from Peru | 14.3 /100 | #203 | Poor 54.4% |
| Immigrants from Belgium | 13.7 /100 | #204 | Poor 54.3% |
| Cheyenne | 13.6 /100 | #205 | Poor 54.3% |
| Immigrants from Latin America | 13.1 /100 | #206 | Poor 54.3% |
Immigrants from Norway 2 or more Vehicles in Household Correlation Summary
| Measurement | Immigrants from Norway Data | 2 or more Vehicles in Household Data |
| Minimum | 0.022% | 38.6% |
| Maximum | 25.9% | 100.0% |
| Range | 25.9% | 61.4% |
| Mean | 3.1% | 70.1% |
| Median | 1.9% | 69.5% |
| Interquartile 25% (IQ1) | 0.90% | 60.2% |
| Interquartile 75% (IQ3) | 3.3% | 76.9% |
| Interquartile Range (IQR) | 2.4% | 16.7% |
| Standard Deviation (Sample) | 4.8% | 15.0% |
| Standard Deviation (Population) | 4.7% | 14.7% |
Correlation Details
| Immigrants from Norway Percentile | Sample Size | 2 or more Vehicles in Household |
[ 0.0% - 0.5% ] 0.022% | 111,708,289 | 50.8% |
[ 0.0% - 0.5% ] 0.18% | 3,451,410 | 60.0% |
[ 0.0% - 0.5% ] 0.30% | 783,191 | 61.2% |
[ 0.0% - 0.5% ] 0.42% | 309,861 | 62.0% |
[ 0.5% - 1.0% ] 0.58% | 177,516 | 61.5% |
[ 0.5% - 1.0% ] 0.70% | 88,662 | 70.0% |
[ 0.5% - 1.0% ] 0.82% | 79,085 | 38.6% |
[ 0.5% - 1.0% ] 0.98% | 9,635 | 72.0% |
[ 1.0% - 1.5% ] 1.08% | 9,218 | 59.3% |
[ 1.0% - 1.5% ] 1.21% | 9,232 | 60.4% |
[ 1.0% - 1.5% ] 1.37% | 3,872 | 78.7% |
[ 1.5% - 2.0% ] 1.53% | 18,517 | 74.4% |
[ 1.5% - 2.0% ] 1.65% | 9,211 | 53.8% |
[ 1.5% - 2.0% ] 1.79% | 7,001 | 52.4% |
[ 2.0% - 2.5% ] 2.01% | 1,638 | 66.0% |
[ 2.0% - 2.5% ] 2.22% | 3,114 | 90.5% |
[ 2.0% - 2.5% ] 2.40% | 3,956 | 68.9% |
[ 2.5% - 3.0% ] 2.53% | 553 | 95.2% |
[ 2.5% - 3.0% ] 2.75% | 473 | 89.4% |
[ 3.0% - 3.5% ] 3.14% | 159 | 75.0% |
[ 3.0% - 3.5% ] 3.27% | 1,897 | 57.3% |
[ 3.0% - 3.5% ] 3.42% | 3,246 | 73.8% |
[ 3.5% - 4.0% ] 3.72% | 1,102 | 75.1% |
[ 4.0% - 4.5% ] 4.12% | 2,692 | 74.3% |
[ 4.5% - 5.0% ] 4.52% | 177 | 96.6% |
[ 5.0% - 5.5% ] 5.17% | 4,586 | 63.3% |
[ 7.5% - 8.0% ] 7.81% | 64 | 82.4% |
[ 25.5% - 26.0% ] 25.93% | 54 | 100.0% |