Immigrants from Norway GED/Equivalency

COMPARE

Immigrants from Norway
Race
Ancestry
AfghanAfricanAlaska NativeAlaskan AthabascanAlbanianAleutAlsatianAmericanApacheArabArapahoArgentineanArmenianAssyrian/Chaldean/SyriacAustralianAustrianBahamianBangladeshiBarbadianBasqueBelgianBelizeanBermudanBhutaneseBlackfeetBolivianBrazilianBritishBritish West IndianBulgarianBurmeseCajunCambodianCanadianCape VerdeanCarpatho RusynCelticCentral AmericanCentral American IndianCherokeeCheyenneChickasawChileanChineseChippewaChoctawColombianColvilleComancheCosta RicanCreeCreekCroatianCrowCubanCypriotCzechCzechoslovakianDanishDelawareDominicanDutchDutch West IndianEastern EuropeanEcuadorianEgyptianEnglishEstonianEthiopianEuropeanFijianFilipinoFinnishFrenchFrench American IndianFrench CanadianGermanGerman RussianGhanaianGreekGuamanian/ChamorroGuatemalanGuyaneseHaitianHmongHonduranHopiHoumaHungarianIcelanderIndian (Asian)IndonesianInupiatIranianIraqiIrishIroquoisIsraeliItalianJamaicanJapaneseJordanianKenyanKiowaKoreanLaotianLatvianLebaneseLiberianLithuanianLumbeeLuxembourgerMacedonianMalaysianMalteseMarshalleseMenomineeMexicanMexican American IndianMongolianMoroccanNative HawaiianNavajoNepaleseNew ZealanderNicaraguanNigerianNorthern EuropeanNorwegianOkinawanOsageOttawaPaiutePakistaniPalestinianPanamanianParaguayanPennsylvania GermanPeruvianPimaPolishPortuguesePotawatomiPuebloPuerto RicanPuget Sound SalishRomanianRussianSalvadoranSamoanScandinavianScotch-IrishScottishSeminoleSenegaleseSerbianShoshoneSierra LeoneanSiouxSlavicSlovakSloveneSomaliSouth AfricanSouth AmericanSouth American IndianSoviet UnionSpaniardSpanishSpanish AmericanSpanish American IndianSri LankanSubsaharan AfricanSudaneseSwedishSwissSyrianTaiwaneseThaiTlingit-HaidaTohono O'OdhamTonganTrinidadian and TobagonianTsimshianTurkishU.S. Virgin IslanderUgandanUkrainianUruguayanUteVenezuelanVietnameseWelshWest IndianYakamaYaquiYugoslavianYumanYup'ikZimbabwean
Immigration
NonimmigrantsImmigrantsAfghanistanAfricaAlbaniaArgentinaArmeniaAsiaAustraliaAustriaBahamasBangladeshBarbadosBelarusBelgiumBelizeBoliviaBosnia and HerzegovinaBrazilBulgariaBurma/MyanmarCabo VerdeCambodiaCameroonCanadaCaribbeanCentral AmericaChileChinaColombiaCongoCosta RicaCroatiaCubaCzechoslovakiaDenmarkDominicaDominican RepublicEastern AfricaEastern AsiaEastern EuropeEcuadorEgyptEl SalvadorEnglandEritreaEthiopiaEuropeFijiFranceGermanyGhanaGreeceGrenadaGuatemalaGuyanaHaitiHondurasHong KongHungaryIndiaIndonesiaIranIraqIrelandIsraelItalyJamaicaJapanJordanKazakhstanKenyaKoreaKuwaitLaosLatin AmericaLatviaLebanonLiberiaLithuaniaMalaysiaMexicoMicronesiaMiddle AfricaMoldovaMoroccoNepalNetherlandsNicaraguaNigeriaNorth AmericaNorth MacedoniaNorthern AfricaNorthern EuropeNorwayOceaniaPakistanPanamaPeruPhilippinesPolandPortugalRomaniaRussiaSaudi ArabiaScotlandSenegalSerbiaSierra LeoneSingaporeSomaliaSouth AfricaSouth AmericaSouth Central AsiaSouth Eastern AsiaSouthern EuropeSpainSri LankaSt. Vincent and the GrenadinesSudanSwedenSwitzerlandSyriaTaiwanThailandTrinidad and TobagoTurkeyUgandaUkraineUruguayUzbekistanVenezuelaVietnamWest IndiesWestern AfricaWestern AsiaWestern EuropeYemenZaireZimbabweAzores
Select to Compare
Race
Ancestry
AfghanAfricanAlaska NativeAlaskan AthabascanAlbanianAleutAlsatianAmericanApacheArabArapahoArgentineanArmenianAssyrian/Chaldean/SyriacAustralianAustrianBahamianBangladeshiBarbadianBasqueBelgianBelizeanBermudanBhutaneseBlackfeetBolivianBrazilianBritishBritish West IndianBulgarianBurmeseCajunCambodianCanadianCape VerdeanCarpatho RusynCelticCentral AmericanCentral American IndianCherokeeCheyenneChickasawChileanChineseChippewaChoctawColombianColvilleComancheCosta RicanCreeCreekCroatianCrowCubanCypriotCzechCzechoslovakianDanishDelawareDominicanDutchDutch West IndianEastern EuropeanEcuadorianEgyptianEnglishEstonianEthiopianEuropeanFijianFilipinoFinnishFrenchFrench American IndianFrench CanadianGermanGerman RussianGhanaianGreekGuamanian/ChamorroGuatemalanGuyaneseHaitianHmongHonduranHopiHoumaHungarianIcelanderIndian (Asian)IndonesianInupiatIranianIraqiIrishIroquoisIsraeliItalianJamaicanJapaneseJordanianKenyanKiowaKoreanLaotianLatvianLebaneseLiberianLithuanianLumbeeLuxembourgerMacedonianMalaysianMalteseMarshalleseMenomineeMexicanMexican American IndianMongolianMoroccanNative HawaiianNavajoNepaleseNew ZealanderNicaraguanNigerianNorthern EuropeanNorwegianOkinawanOsageOttawaPaiutePakistaniPalestinianPanamanianParaguayanPennsylvania GermanPeruvianPimaPolishPortuguesePotawatomiPuebloPuerto RicanPuget Sound SalishRomanianRussianSalvadoranSamoanScandinavianScotch-IrishScottishSeminoleSenegaleseSerbianShoshoneSierra LeoneanSiouxSlavicSlovakSloveneSomaliSouth AfricanSouth AmericanSouth American IndianSoviet UnionSpaniardSpanishSpanish AmericanSpanish American IndianSri LankanSubsaharan AfricanSudaneseSwedishSwissSyrianTaiwaneseThaiTlingit-HaidaTohono O'OdhamTonganTrinidadian and TobagonianTsimshianTurkishU.S. Virgin IslanderUgandanUkrainianUruguayanUteVenezuelanVietnameseWelshWest IndianYakamaYaquiYugoslavianYumanYup'ikZimbabwean
Immigration
NonimmigrantsImmigrantsAfghanistanAfricaAlbaniaArgentinaArmeniaAsiaAustraliaAustriaBahamasBangladeshBarbadosBelarusBelgiumBelizeBoliviaBosnia and HerzegovinaBrazilBulgariaBurma/MyanmarCabo VerdeCambodiaCameroonCanadaCaribbeanCentral AmericaChileChinaColombiaCongoCosta RicaCroatiaCubaCzechoslovakiaDenmarkDominicaDominican RepublicEastern AfricaEastern AsiaEastern EuropeEcuadorEgyptEl SalvadorEnglandEritreaEthiopiaEuropeFijiFranceGermanyGhanaGreeceGrenadaGuatemalaGuyanaHaitiHondurasHong KongHungaryIndiaIndonesiaIranIraqIrelandIsraelItalyJamaicaJapanJordanKazakhstanKenyaKoreaKuwaitLaosLatin AmericaLatviaLebanonLiberiaLithuaniaMalaysiaMexicoMicronesiaMiddle AfricaMoldovaMoroccoNepalNetherlandsNicaraguaNigeriaNorth AmericaNorth MacedoniaNorthern AfricaNorthern EuropeOceaniaPakistanPanamaPeruPhilippinesPolandPortugalRomaniaRussiaSaudi ArabiaScotlandSenegalSerbiaSierra LeoneSingaporeSomaliaSouth AfricaSouth AmericaSouth Central AsiaSouth Eastern AsiaSouthern EuropeSpainSri LankaSt. Vincent and the GrenadinesSudanSwedenSwitzerlandSyriaTaiwanThailandTrinidad and TobagoTurkeyUgandaUkraineUruguayUzbekistanVenezuelaVietnamWest IndiesWestern AfricaWestern AsiaWestern EuropeYemenZaireZimbabweAzores
GED/Equivalency
Income
Poverty
Unemployment
Labor Participation
Family Structure
Vehicle Availability
Education Level
Disability

Immigrants from Norway GED/Equivalency
Exceptional

87.5%
GED/EQUIVALENCY
98.1/ 100
METRIC RATING
88th/ 347
METRIC RANK

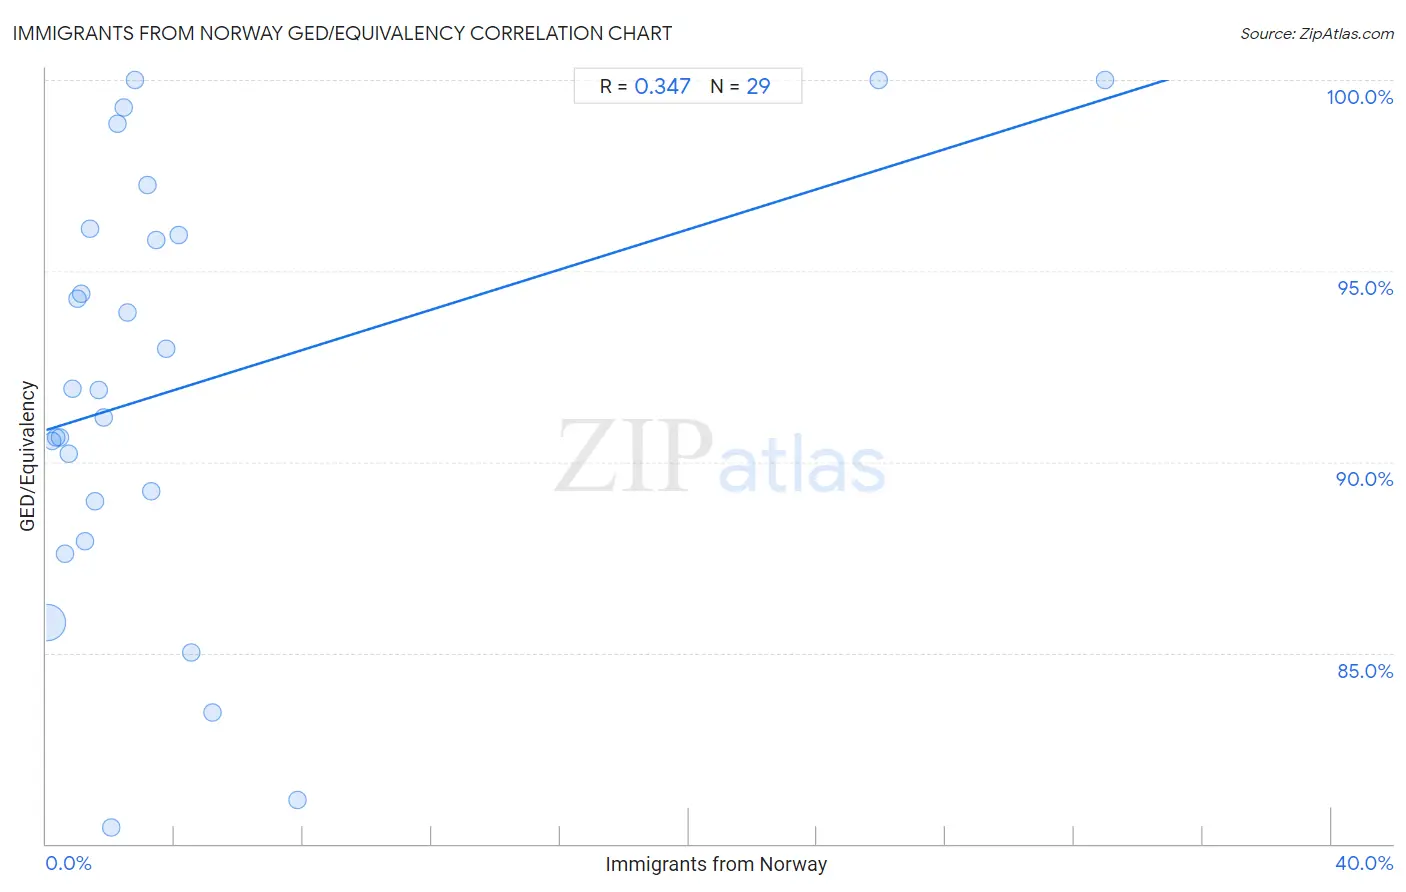
Immigrants from Norway GED/Equivalency Correlation Chart

The statistical analysis conducted on geographies consisting of 116,716,420 people shows a mild positive correlation between the proportion of Immigrants from Norway and percentage of population with at least ged/equivalency education in the United States with a correlation coefficient (R) of 0.347 and weighted average of 87.5%. On average, for every 1% (one percent) increase in Immigrants from Norway within a typical geography, there is an increase of 0.26% in percentage of population with at least ged/equivalency education.
Immigrants from Norway GED/Equivalency
It is essential to understand that the correlation between the percentage of Immigrants from Norway and percentage of population with at least ged/equivalency education does not imply a direct cause-and-effect relationship. It remains uncertain whether the presence of Immigrants from Norway influences an upward or downward trend in the level of percentage of population with at least ged/equivalency education within an area, or if Immigrants from Norway simply ended up residing in those areas with higher or lower levels of percentage of population with at least ged/equivalency education due to other factors.

Demographics Similar to Immigrants from Norway by GED/Equivalency

In terms of ged/equivalency, the demographic groups most similar to Immigrants from Norway are Immigrants from Europe (87.5%, a difference of 0.010%), Native Hawaiian (87.5%, a difference of 0.010%), Immigrants from Romania (87.5%, a difference of 0.020%), Dutch (87.5%, a difference of 0.020%), and Hungarian (87.4%, a difference of 0.040%).
DemographicsRating | RankGED/Equivalency
Immigrants from Sri Lanka
98.3
/100
|
#81
Exceptional
87.5%
Romanians
98.3
/100
|
#82
Exceptional
87.5%
South Africans
98.3
/100
|
#83
Exceptional
87.5%
Immigrants from Romania
98.1
/100
|
#84
Exceptional
87.5%
Dutch
98.1
/100
|
#85
Exceptional
87.5%
Immigrants from Europe
98.1
/100
|
#86
Exceptional
87.5%
Native Hawaiians
98.1
/100
|
#87
Exceptional
87.5%
Immigrants from Norway
98.1
/100
|
#88
Exceptional
87.5%
Hungarians
97.9
/100
|
#89
Exceptional
87.4%
Welsh
97.9
/100
|
#90
Exceptional
87.4%
Immigrants from Eastern Asia
97.9
/100
|
#91
Exceptional
87.4%
Israelis
97.8
/100
|
#92
Exceptional
87.4%
Immigrants from North Macedonia
97.8
/100
|
#93
Exceptional
87.4%
Immigrants from Russia
97.8
/100
|
#94
Exceptional
87.4%
Immigrants from Greece
97.7
/100
|
#95
Exceptional
87.4%

Immigrants from Norway GED/Equivalency Correlation Summary

MeasurementImmigrants from Norway DataGED/Equivalency Data
Minimum0.022%80.4%
Maximum33.0%100.0%
Range32.9%19.6%
Mean4.1%91.9%
Median2.0%91.9%
Interquartile 25% (IQ1)0.90%88.5%
Interquartile 75% (IQ3)3.6%96.0%
Interquartile Range (IQR)2.7%7.6%
Standard Deviation (Sample)7.3%5.5%
Standard Deviation (Population)7.2%5.4%

Correlation Details

Immigrants from Norway PercentileSample SizeGED/Equivalency
[
0.0%
-
0.5%
]
0.022%
111,729,76285.8%
[
0.0%
-
0.5%
]
0.18%
3,454,04290.6%
[
0.0%
-
0.5%
]
0.30%
783,19190.6%
[
0.0%
-
0.5%
]
0.42%
313,67790.6%
[
0.5%
-
1.0%
]
0.58%
177,51687.6%
[
0.5%
-
1.0%
]
0.70%
88,66290.2%
[
0.5%
-
1.0%
]
0.82%
79,08591.9%
[
0.5%
-
1.0%
]
0.98%
9,63594.3%
[
1.0%
-
1.5%
]
1.08%
9,21894.4%
[
1.0%
-
1.5%
]
1.21%
9,23287.9%
[
1.0%
-
1.5%
]
1.37%
3,87296.1%
[
1.5%
-
2.0%
]
1.53%
18,51789.0%
[
1.5%
-
2.0%
]
1.65%
9,21191.9%
[
1.5%
-
2.0%
]
1.79%
7,00191.2%
[
2.0%
-
2.5%
]
2.01%
1,63880.4%
[
2.0%
-
2.5%
]
2.22%
3,11498.8%
[
2.0%
-
2.5%
]
2.40%
3,95699.3%
[
2.5%
-
3.0%
]
2.53%
55393.9%
[
2.5%
-
3.0%
]
2.75%
473100.0%
[
3.0%
-
3.5%
]
3.14%
15997.2%
[
3.0%
-
3.5%
]
3.27%
1,89789.2%
[
3.0%
-
3.5%
]
3.42%
3,24695.8%
[
3.5%
-
4.0%
]
3.72%
1,10292.9%
[
4.0%
-
4.5%
]
4.12%
2,69295.9%
[
4.5%
-
5.0%
]
4.52%
17785.0%
[
5.0%
-
5.5%
]
5.17%
4,58683.4%
[
7.5%
-
8.0%
]
7.81%
6481.1%
[
25.5%
-
26.0%
]
25.93%
54100.0%
[
32.5%
-
33.0%
]
32.95%
88100.0%