Immigrants from Micronesia Married-couple Households

COMPARE

Immigrants from Micronesia
Race
Ancestry
AfghanAfricanAlaska NativeAlaskan AthabascanAlbanianAleutAlsatianAmericanApacheArabArapahoArgentineanArmenianAssyrian/Chaldean/SyriacAustralianAustrianBahamianBangladeshiBarbadianBasqueBelgianBelizeanBermudanBhutaneseBlackfeetBolivianBrazilianBritishBritish West IndianBulgarianBurmeseCajunCambodianCanadianCape VerdeanCarpatho RusynCelticCentral AmericanCentral American IndianCherokeeCheyenneChickasawChileanChineseChippewaChoctawColombianColvilleComancheCosta RicanCreeCreekCroatianCrowCubanCypriotCzechCzechoslovakianDanishDelawareDominicanDutchDutch West IndianEastern EuropeanEcuadorianEgyptianEnglishEstonianEthiopianEuropeanFijianFilipinoFinnishFrenchFrench American IndianFrench CanadianGermanGerman RussianGhanaianGreekGuamanian/ChamorroGuatemalanGuyaneseHaitianHmongHonduranHopiHoumaHungarianIcelanderIndian (Asian)IndonesianInupiatIranianIraqiIrishIroquoisIsraeliItalianJamaicanJapaneseJordanianKenyanKiowaKoreanLaotianLatvianLebaneseLiberianLithuanianLumbeeLuxembourgerMacedonianMalaysianMalteseMarshalleseMenomineeMexicanMexican American IndianMongolianMoroccanNative HawaiianNavajoNepaleseNew ZealanderNicaraguanNigerianNorthern EuropeanNorwegianOkinawanOsageOttawaPaiutePakistaniPalestinianPanamanianParaguayanPennsylvania GermanPeruvianPimaPolishPortuguesePotawatomiPuebloPuerto RicanPuget Sound SalishRomanianRussianSalvadoranSamoanScandinavianScotch-IrishScottishSeminoleSenegaleseSerbianShoshoneSierra LeoneanSiouxSlavicSlovakSloveneSomaliSouth AfricanSouth AmericanSouth American IndianSoviet UnionSpaniardSpanishSpanish AmericanSpanish American IndianSri LankanSubsaharan AfricanSudaneseSwedishSwissSyrianTaiwaneseThaiTlingit-HaidaTohono O'OdhamTonganTrinidadian and TobagonianTsimshianTurkishU.S. Virgin IslanderUgandanUkrainianUruguayanUteVenezuelanVietnameseWelshWest IndianYakamaYaquiYugoslavianYumanYup'ikZimbabwean
Immigration
NonimmigrantsImmigrantsAfghanistanAfricaAlbaniaArgentinaArmeniaAsiaAustraliaAustriaBahamasBangladeshBarbadosBelarusBelgiumBelizeBoliviaBosnia and HerzegovinaBrazilBulgariaBurma/MyanmarCabo VerdeCambodiaCameroonCanadaCaribbeanCentral AmericaChileChinaColombiaCongoCosta RicaCroatiaCubaCzechoslovakiaDenmarkDominicaDominican RepublicEastern AfricaEastern AsiaEastern EuropeEcuadorEgyptEl SalvadorEnglandEritreaEthiopiaEuropeFijiFranceGermanyGhanaGreeceGrenadaGuatemalaGuyanaHaitiHondurasHong KongHungaryIndiaIndonesiaIranIraqIrelandIsraelItalyJamaicaJapanJordanKazakhstanKenyaKoreaKuwaitLaosLatin AmericaLatviaLebanonLiberiaLithuaniaMalaysiaMexicoMicronesiaMiddle AfricaMoldovaMoroccoNepalNetherlandsNicaraguaNigeriaNorth AmericaNorth MacedoniaNorthern AfricaNorthern EuropeNorwayOceaniaPakistanPanamaPeruPhilippinesPolandPortugalRomaniaRussiaSaudi ArabiaScotlandSenegalSerbiaSierra LeoneSingaporeSomaliaSouth AfricaSouth AmericaSouth Central AsiaSouth Eastern AsiaSouthern EuropeSpainSri LankaSt. Vincent and the GrenadinesSudanSwedenSwitzerlandSyriaTaiwanThailandTrinidad and TobagoTurkeyUgandaUkraineUruguayUzbekistanVenezuelaVietnamWest IndiesWestern AfricaWestern AsiaWestern EuropeYemenZaireZimbabweAzores
Select to Compare
Race
Ancestry
AfghanAfricanAlaska NativeAlaskan AthabascanAlbanianAleutAlsatianAmericanApacheArabArapahoArgentineanArmenianAssyrian/Chaldean/SyriacAustralianAustrianBahamianBangladeshiBarbadianBasqueBelgianBelizeanBermudanBhutaneseBlackfeetBolivianBrazilianBritishBritish West IndianBulgarianBurmeseCajunCambodianCanadianCape VerdeanCarpatho RusynCelticCentral AmericanCentral American IndianCherokeeCheyenneChickasawChileanChineseChippewaChoctawColombianColvilleComancheCosta RicanCreeCreekCroatianCrowCubanCypriotCzechCzechoslovakianDanishDelawareDominicanDutchDutch West IndianEastern EuropeanEcuadorianEgyptianEnglishEstonianEthiopianEuropeanFijianFilipinoFinnishFrenchFrench American IndianFrench CanadianGermanGerman RussianGhanaianGreekGuamanian/ChamorroGuatemalanGuyaneseHaitianHmongHonduranHopiHoumaHungarianIcelanderIndian (Asian)IndonesianInupiatIranianIraqiIrishIroquoisIsraeliItalianJamaicanJapaneseJordanianKenyanKiowaKoreanLaotianLatvianLebaneseLiberianLithuanianLumbeeLuxembourgerMacedonianMalaysianMalteseMarshalleseMenomineeMexicanMexican American IndianMongolianMoroccanNative HawaiianNavajoNepaleseNew ZealanderNicaraguanNigerianNorthern EuropeanNorwegianOkinawanOsageOttawaPaiutePakistaniPalestinianPanamanianParaguayanPennsylvania GermanPeruvianPimaPolishPortuguesePotawatomiPuebloPuerto RicanPuget Sound SalishRomanianRussianSalvadoranSamoanScandinavianScotch-IrishScottishSeminoleSenegaleseSerbianShoshoneSierra LeoneanSiouxSlavicSlovakSloveneSomaliSouth AfricanSouth AmericanSouth American IndianSoviet UnionSpaniardSpanishSpanish AmericanSpanish American IndianSri LankanSubsaharan AfricanSudaneseSwedishSwissSyrianTaiwaneseThaiTlingit-HaidaTohono O'OdhamTonganTrinidadian and TobagonianTsimshianTurkishU.S. Virgin IslanderUgandanUkrainianUruguayanUteVenezuelanVietnameseWelshWest IndianYakamaYaquiYugoslavianYumanYup'ikZimbabwean
Immigration
NonimmigrantsImmigrantsAfghanistanAfricaAlbaniaArgentinaArmeniaAsiaAustraliaAustriaBahamasBangladeshBarbadosBelarusBelgiumBelizeBoliviaBosnia and HerzegovinaBrazilBulgariaBurma/MyanmarCabo VerdeCambodiaCameroonCanadaCaribbeanCentral AmericaChileChinaColombiaCongoCosta RicaCroatiaCubaCzechoslovakiaDenmarkDominicaDominican RepublicEastern AfricaEastern AsiaEastern EuropeEcuadorEgyptEl SalvadorEnglandEritreaEthiopiaEuropeFijiFranceGermanyGhanaGreeceGrenadaGuatemalaGuyanaHaitiHondurasHong KongHungaryIndiaIndonesiaIranIraqIrelandIsraelItalyJamaicaJapanJordanKazakhstanKenyaKoreaKuwaitLaosLatin AmericaLatviaLebanonLiberiaLithuaniaMalaysiaMexicoMiddle AfricaMoldovaMoroccoNepalNetherlandsNicaraguaNigeriaNorth AmericaNorth MacedoniaNorthern AfricaNorthern EuropeNorwayOceaniaPakistanPanamaPeruPhilippinesPolandPortugalRomaniaRussiaSaudi ArabiaScotlandSenegalSerbiaSierra LeoneSingaporeSomaliaSouth AfricaSouth AmericaSouth Central AsiaSouth Eastern AsiaSouthern EuropeSpainSri LankaSt. Vincent and the GrenadinesSudanSwedenSwitzerlandSyriaTaiwanThailandTrinidad and TobagoTurkeyUgandaUkraineUruguayUzbekistanVenezuelaVietnamWest IndiesWestern AfricaWestern AsiaWestern EuropeYemenZaireZimbabweAzores
Married-couple Households
Income
Poverty
Unemployment
Labor Participation
Family Structure
Vehicle Availability
Education Level
Disability

Immigrants from Micronesia Married-couple Households
Tragic

44.9%
MARRIED-COUPLE HOUSEHOLDS
2.6/ 100
METRIC RATING
224th/ 347
METRIC RANK

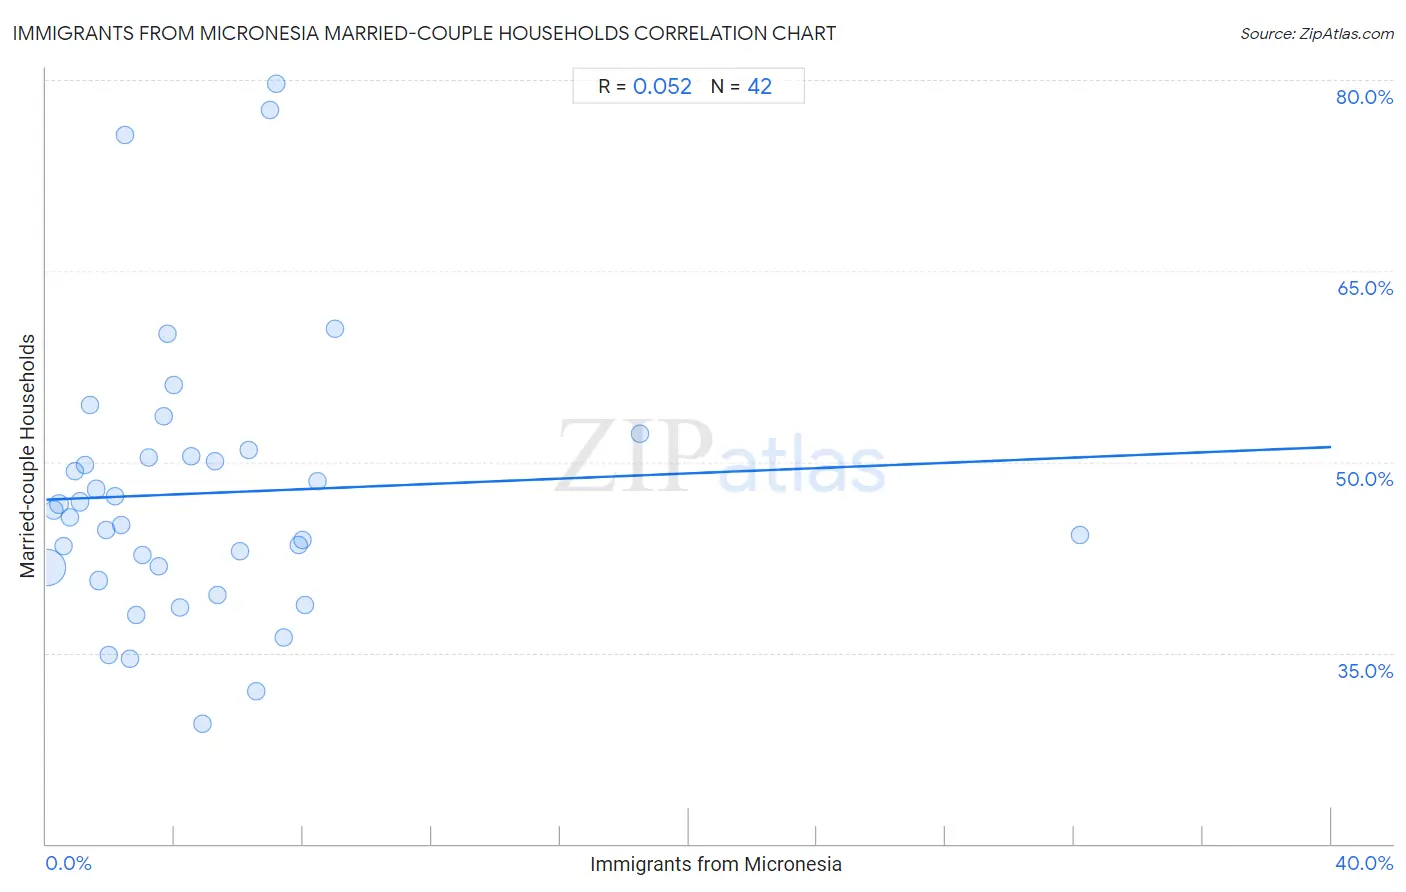
Immigrants from Micronesia Married-couple Households Correlation Chart

The statistical analysis conducted on geographies consisting of 61,600,267 people shows a slight positive correlation between the proportion of Immigrants from Micronesia and percentage of married-couple family households in the United States with a correlation coefficient (R) of 0.052 and weighted average of 44.9%. On average, for every 1% (one percent) increase in Immigrants from Micronesia within a typical geography, there is an increase of 0.10% in percentage of married-couple family households.
Immigrants from Micronesia Married-couple Households
It is essential to understand that the correlation between the percentage of Immigrants from Micronesia and percentage of married-couple family households does not imply a direct cause-and-effect relationship. It remains uncertain whether the presence of Immigrants from Micronesia influences an upward or downward trend in the level of percentage of married-couple family households within an area, or if Immigrants from Micronesia simply ended up residing in those areas with higher or lower levels of percentage of married-couple family households due to other factors.

Demographics Similar to Immigrants from Micronesia by Married-couple Households

In terms of married-couple households, the demographic groups most similar to Immigrants from Micronesia are Dutch West Indian (44.9%, a difference of 0.020%), Immigrants from Cambodia (44.9%, a difference of 0.030%), Alsatian (44.8%, a difference of 0.12%), Salvadoran (44.7%, a difference of 0.31%), and Kenyan (44.7%, a difference of 0.43%).
DemographicsRating | RankMarried-couple Households
Panamanians
5.5
/100
|
#217
Tragic
45.2%
Immigrants from the Azores
5.3
/100
|
#218
Tragic
45.2%
Nicaraguans
5.3
/100
|
#219
Tragic
45.2%
Immigrants from Thailand
5.1
/100
|
#220
Tragic
45.2%
Tlingit-Haida
4.9
/100
|
#221
Tragic
45.1%
Immigrants from Laos
4.6
/100
|
#222
Tragic
45.1%
Immigrants from Cambodia
2.7
/100
|
#223
Tragic
44.9%
Immigrants from Micronesia
2.6
/100
|
#224
Tragic
44.9%
Dutch West Indians
2.6
/100
|
#225
Tragic
44.9%
Alsatians
2.3
/100
|
#226
Tragic
44.8%
Salvadorans
1.9
/100
|
#227
Tragic
44.7%
Kenyans
1.7
/100
|
#228
Tragic
44.7%
Immigrants from Latin America
1.6
/100
|
#229
Tragic
44.7%
Soviet Union
1.6
/100
|
#230
Tragic
44.6%
Houma
1.5
/100
|
#231
Tragic
44.6%

Immigrants from Micronesia Married-couple Households Correlation Summary

MeasurementImmigrants from Micronesia DataMarried-couple Households Data
Minimum0.022%29.5%
Maximum32.2%79.7%
Range32.1%50.3%
Mean4.8%47.5%
Median3.6%45.9%
Interquartile 25% (IQ1)1.6%41.7%
Interquartile 75% (IQ3)6.5%50.4%
Interquartile Range (IQR)4.9%8.7%
Standard Deviation (Sample)5.5%10.9%
Standard Deviation (Population)5.5%10.7%

Correlation Details

Immigrants from Micronesia PercentileSample SizeMarried-couple Households
[
0.0%
-
0.5%
]
0.022%
53,363,86741.7%
[
0.0%
-
0.5%
]
0.22%
3,462,05546.3%
[
0.0%
-
0.5%
]
0.39%
1,633,11146.7%
[
0.5%
-
1.0%
]
0.54%
910,38943.4%
[
0.5%
-
1.0%
]
0.73%
521,69245.6%
[
0.5%
-
1.0%
]
0.90%
465,45849.3%
[
1.0%
-
1.5%
]
1.05%
183,11546.9%
[
1.0%
-
1.5%
]
1.22%
79,62249.7%
[
1.0%
-
1.5%
]
1.35%
37,86854.5%
[
1.5%
-
2.0%
]
1.56%
130,25747.8%
[
1.5%
-
2.0%
]
1.63%
382,52440.7%
[
1.5%
-
2.0%
]
1.86%
10,98944.6%
[
1.5%
-
2.0%
]
1.95%
66734.9%
[
2.0%
-
2.5%
]
2.13%
133,47847.3%
[
2.0%
-
2.5%
]
2.33%
78,52645.0%
[
2.0%
-
2.5%
]
2.46%
1,90775.6%
[
2.5%
-
3.0%
]
2.59%
55,47334.5%
[
2.5%
-
3.0%
]
2.81%
3,70138.0%
[
2.5%
-
3.0%
]
2.99%
8,25442.7%
[
3.0%
-
3.5%
]
3.19%
58,74250.4%
[
3.0%
-
3.5%
]
3.48%
9,70241.8%
[
3.5%
-
4.0%
]
3.66%
9,38353.6%
[
3.5%
-
4.0%
]
3.79%
10,78660.1%
[
3.5%
-
4.0%
]
3.95%
11,20756.1%
[
4.0%
-
4.5%
]
4.17%
62438.6%
[
4.5%
-
5.0%
]
4.52%
1,12950.4%
[
4.5%
-
5.0%
]
4.87%
10,04229.5%
[
5.0%
-
5.5%
]
5.26%
2,35650.0%
[
5.0%
-
5.5%
]
5.31%
41439.6%
[
6.0%
-
6.5%
]
6.04%
84443.0%
[
6.0%
-
6.5%
]
6.28%
2,00551.0%
[
6.5%
-
7.0%
]
6.52%
3,80132.0%
[
6.5%
-
7.0%
]
6.97%
20177.6%
[
7.0%
-
7.5%
]
7.14%
19679.7%
[
7.0%
-
7.5%
]
7.41%
8136.2%
[
7.5%
-
8.0%
]
7.87%
4,84243.5%
[
7.5%
-
8.0%
]
7.96%
5,39143.8%
[
8.0%
-
8.5%
]
8.05%
2,82038.8%
[
8.0%
-
8.5%
]
8.44%
37948.5%
[
8.5%
-
9.0%
]
9.00%
1,27860.4%
[
18.0%
-
18.5%
]
18.47%
69352.2%
[
32.0%
-
32.5%
]
32.16%
39844.3%