Immigrants from Micronesia Wage/Income Gap

COMPARE

Immigrants from Micronesia
Race
Ancestry
AfghanAfricanAlaska NativeAlaskan AthabascanAlbanianAleutAlsatianAmericanApacheArabArapahoArgentineanArmenianAssyrian/Chaldean/SyriacAustralianAustrianBahamianBangladeshiBarbadianBasqueBelgianBelizeanBermudanBhutaneseBlackfeetBolivianBrazilianBritishBritish West IndianBulgarianBurmeseCajunCambodianCanadianCape VerdeanCarpatho RusynCelticCentral AmericanCentral American IndianCherokeeCheyenneChickasawChileanChineseChippewaChoctawColombianColvilleComancheCosta RicanCreeCreekCroatianCrowCubanCypriotCzechCzechoslovakianDanishDelawareDominicanDutchDutch West IndianEastern EuropeanEcuadorianEgyptianEnglishEstonianEthiopianEuropeanFijianFilipinoFinnishFrenchFrench American IndianFrench CanadianGermanGerman RussianGhanaianGreekGuamanian/ChamorroGuatemalanGuyaneseHaitianHmongHonduranHopiHoumaHungarianIcelanderIndian (Asian)IndonesianInupiatIranianIraqiIrishIroquoisIsraeliItalianJamaicanJapaneseJordanianKenyanKiowaKoreanLaotianLatvianLebaneseLiberianLithuanianLumbeeLuxembourgerMacedonianMalaysianMalteseMarshalleseMenomineeMexicanMexican American IndianMongolianMoroccanNative HawaiianNavajoNepaleseNew ZealanderNicaraguanNigerianNorthern EuropeanNorwegianOkinawanOsageOttawaPaiutePakistaniPalestinianPanamanianParaguayanPennsylvania GermanPeruvianPimaPolishPortuguesePotawatomiPuebloPuerto RicanPuget Sound SalishRomanianRussianSalvadoranSamoanScandinavianScotch-IrishScottishSeminoleSenegaleseSerbianShoshoneSierra LeoneanSiouxSlavicSlovakSloveneSomaliSouth AfricanSouth AmericanSouth American IndianSoviet UnionSpaniardSpanishSpanish AmericanSpanish American IndianSri LankanSubsaharan AfricanSudaneseSwedishSwissSyrianTaiwaneseThaiTlingit-HaidaTohono O'OdhamTonganTrinidadian and TobagonianTsimshianTurkishU.S. Virgin IslanderUgandanUkrainianUruguayanUteVenezuelanVietnameseWelshWest IndianYakamaYaquiYugoslavianYumanYup'ikZimbabwean
Immigration
NonimmigrantsImmigrantsAfghanistanAfricaAlbaniaArgentinaArmeniaAsiaAustraliaAustriaBahamasBangladeshBarbadosBelarusBelgiumBelizeBoliviaBosnia and HerzegovinaBrazilBulgariaBurma/MyanmarCabo VerdeCambodiaCameroonCanadaCaribbeanCentral AmericaChileChinaColombiaCongoCosta RicaCroatiaCubaCzechoslovakiaDenmarkDominicaDominican RepublicEastern AfricaEastern AsiaEastern EuropeEcuadorEgyptEl SalvadorEnglandEritreaEthiopiaEuropeFijiFranceGermanyGhanaGreeceGrenadaGuatemalaGuyanaHaitiHondurasHong KongHungaryIndiaIndonesiaIranIraqIrelandIsraelItalyJamaicaJapanJordanKazakhstanKenyaKoreaKuwaitLaosLatin AmericaLatviaLebanonLiberiaLithuaniaMalaysiaMexicoMicronesiaMiddle AfricaMoldovaMoroccoNepalNetherlandsNicaraguaNigeriaNorth AmericaNorth MacedoniaNorthern AfricaNorthern EuropeNorwayOceaniaPakistanPanamaPeruPhilippinesPolandPortugalRomaniaRussiaSaudi ArabiaScotlandSenegalSerbiaSierra LeoneSingaporeSomaliaSouth AfricaSouth AmericaSouth Central AsiaSouth Eastern AsiaSouthern EuropeSpainSri LankaSt. Vincent and the GrenadinesSudanSwedenSwitzerlandSyriaTaiwanThailandTrinidad and TobagoTurkeyUgandaUkraineUruguayUzbekistanVenezuelaVietnamWest IndiesWestern AfricaWestern AsiaWestern EuropeYemenZaireZimbabweAzores
Select to Compare
Race
Ancestry
AfghanAfricanAlaska NativeAlaskan AthabascanAlbanianAleutAlsatianAmericanApacheArabArapahoArgentineanArmenianAssyrian/Chaldean/SyriacAustralianAustrianBahamianBangladeshiBarbadianBasqueBelgianBelizeanBermudanBhutaneseBlackfeetBolivianBrazilianBritishBritish West IndianBulgarianBurmeseCajunCambodianCanadianCape VerdeanCarpatho RusynCelticCentral AmericanCentral American IndianCherokeeCheyenneChickasawChileanChineseChippewaChoctawColombianColvilleComancheCosta RicanCreeCreekCroatianCrowCubanCypriotCzechCzechoslovakianDanishDelawareDominicanDutchDutch West IndianEastern EuropeanEcuadorianEgyptianEnglishEstonianEthiopianEuropeanFijianFilipinoFinnishFrenchFrench American IndianFrench CanadianGermanGerman RussianGhanaianGreekGuamanian/ChamorroGuatemalanGuyaneseHaitianHmongHonduranHopiHoumaHungarianIcelanderIndian (Asian)IndonesianInupiatIranianIraqiIrishIroquoisIsraeliItalianJamaicanJapaneseJordanianKenyanKiowaKoreanLaotianLatvianLebaneseLiberianLithuanianLumbeeLuxembourgerMacedonianMalaysianMalteseMarshalleseMenomineeMexicanMexican American IndianMongolianMoroccanNative HawaiianNavajoNepaleseNew ZealanderNicaraguanNigerianNorthern EuropeanNorwegianOkinawanOsageOttawaPaiutePakistaniPalestinianPanamanianParaguayanPennsylvania GermanPeruvianPimaPolishPortuguesePotawatomiPuebloPuerto RicanPuget Sound SalishRomanianRussianSalvadoranSamoanScandinavianScotch-IrishScottishSeminoleSenegaleseSerbianShoshoneSierra LeoneanSiouxSlavicSlovakSloveneSomaliSouth AfricanSouth AmericanSouth American IndianSoviet UnionSpaniardSpanishSpanish AmericanSpanish American IndianSri LankanSubsaharan AfricanSudaneseSwedishSwissSyrianTaiwaneseThaiTlingit-HaidaTohono O'OdhamTonganTrinidadian and TobagonianTsimshianTurkishU.S. Virgin IslanderUgandanUkrainianUruguayanUteVenezuelanVietnameseWelshWest IndianYakamaYaquiYugoslavianYumanYup'ikZimbabwean
Immigration
NonimmigrantsImmigrantsAfghanistanAfricaAlbaniaArgentinaArmeniaAsiaAustraliaAustriaBahamasBangladeshBarbadosBelarusBelgiumBelizeBoliviaBosnia and HerzegovinaBrazilBulgariaBurma/MyanmarCabo VerdeCambodiaCameroonCanadaCaribbeanCentral AmericaChileChinaColombiaCongoCosta RicaCroatiaCubaCzechoslovakiaDenmarkDominicaDominican RepublicEastern AfricaEastern AsiaEastern EuropeEcuadorEgyptEl SalvadorEnglandEritreaEthiopiaEuropeFijiFranceGermanyGhanaGreeceGrenadaGuatemalaGuyanaHaitiHondurasHong KongHungaryIndiaIndonesiaIranIraqIrelandIsraelItalyJamaicaJapanJordanKazakhstanKenyaKoreaKuwaitLaosLatin AmericaLatviaLebanonLiberiaLithuaniaMalaysiaMexicoMiddle AfricaMoldovaMoroccoNepalNetherlandsNicaraguaNigeriaNorth AmericaNorth MacedoniaNorthern AfricaNorthern EuropeNorwayOceaniaPakistanPanamaPeruPhilippinesPolandPortugalRomaniaRussiaSaudi ArabiaScotlandSenegalSerbiaSierra LeoneSingaporeSomaliaSouth AfricaSouth AmericaSouth Central AsiaSouth Eastern AsiaSouthern EuropeSpainSri LankaSt. Vincent and the GrenadinesSudanSwedenSwitzerlandSyriaTaiwanThailandTrinidad and TobagoTurkeyUgandaUkraineUruguayUzbekistanVenezuelaVietnamWest IndiesWestern AfricaWestern AsiaWestern EuropeYemenZaireZimbabweAzores
Wage/Income Gap
Income
Poverty
Unemployment
Labor Participation
Family Structure
Vehicle Availability
Education Level
Disability

Immigrants from Micronesia Wage/Income Gap
Exceptional

24.4%
WAGE/INCOME GAP
95.8/ 100
METRIC RATING
118th/ 347
METRIC RANK

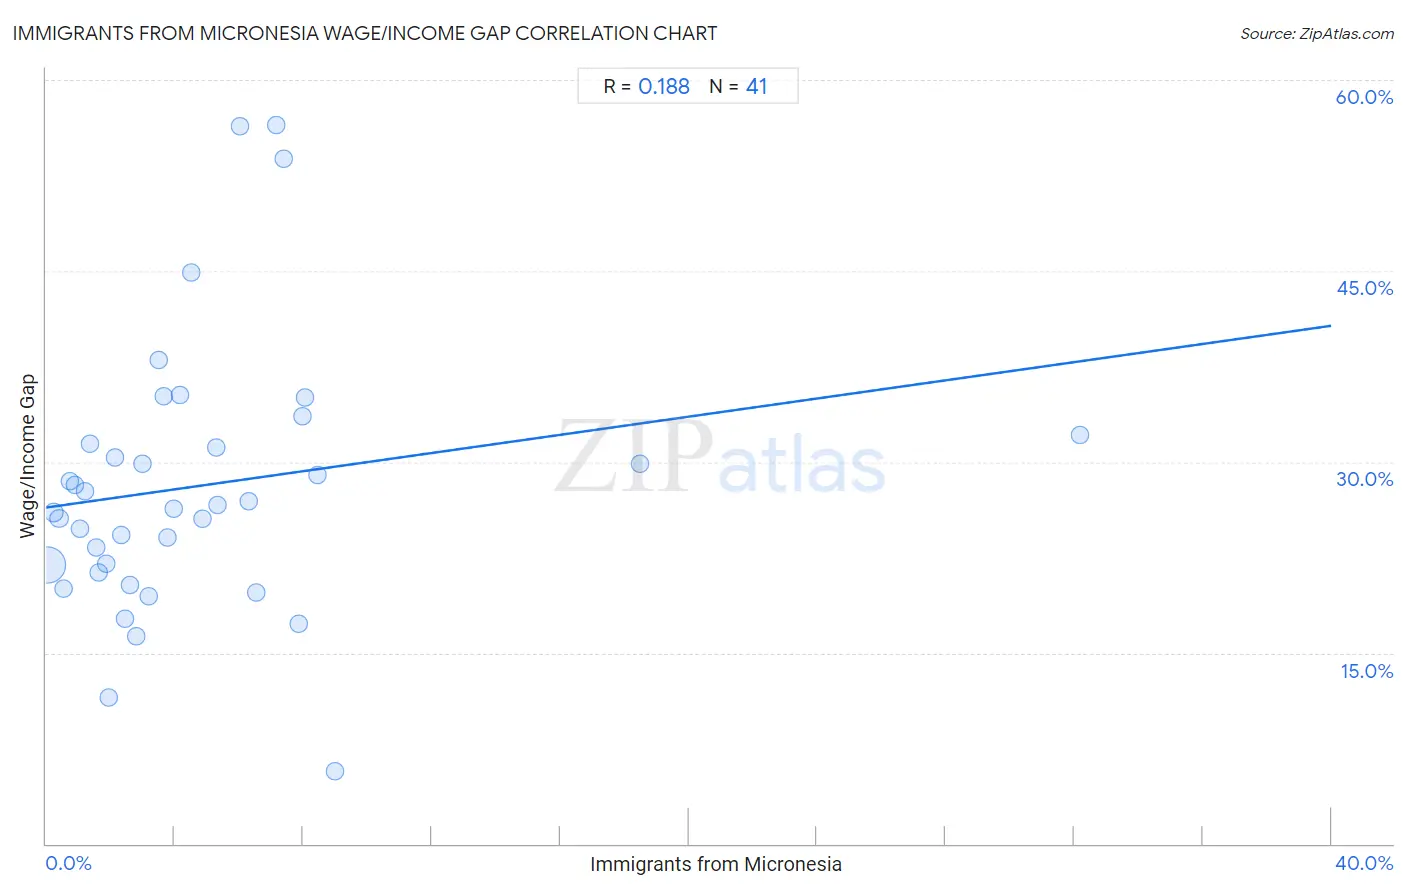
Immigrants from Micronesia Wage/Income Gap Correlation Chart

The statistical analysis conducted on geographies consisting of 61,599,093 people shows a poor positive correlation between the proportion of Immigrants from Micronesia and wage/income gap percentage in the United States with a correlation coefficient (R) of 0.188 and weighted average of 24.4%. On average, for every 1% (one percent) increase in Immigrants from Micronesia within a typical geography, there is an increase of 0.36% in wage/income gap percentage.
Immigrants from Micronesia Wage/Income Gap
It is essential to understand that the correlation between the percentage of Immigrants from Micronesia and wage/income gap percentage does not imply a direct cause-and-effect relationship. It remains uncertain whether the presence of Immigrants from Micronesia influences an upward or downward trend in the level of wage/income gap percentage within an area, or if Immigrants from Micronesia simply ended up residing in those areas with higher or lower levels of wage/income gap percentage due to other factors.

Demographics Similar to Immigrants from Micronesia by Wage/Income Gap

In terms of wage/income gap, the demographic groups most similar to Immigrants from Micronesia are Kenyan (24.5%, a difference of 0.020%), Immigrants from Afghanistan (24.4%, a difference of 0.030%), Alaska Native (24.4%, a difference of 0.090%), Cree (24.5%, a difference of 0.090%), and Immigrants from Kenya (24.4%, a difference of 0.26%).
DemographicsRating | RankWage/Income Gap
Soviet Union
97.6
/100
|
#111
Exceptional
24.2%
Immigrants from Colombia
97.0
/100
|
#112
Exceptional
24.3%
Sioux
96.9
/100
|
#113
Exceptional
24.3%
Panamanians
96.5
/100
|
#114
Exceptional
24.4%
Immigrants from Kenya
96.4
/100
|
#115
Exceptional
24.4%
Alaska Natives
96.0
/100
|
#116
Exceptional
24.4%
Immigrants from Afghanistan
95.9
/100
|
#117
Exceptional
24.4%
Immigrants from Micronesia
95.8
/100
|
#118
Exceptional
24.4%
Kenyans
95.8
/100
|
#119
Exceptional
24.5%
Cree
95.6
/100
|
#120
Exceptional
24.5%
Immigrants from Thailand
94.9
/100
|
#121
Exceptional
24.5%
Apache
94.8
/100
|
#122
Exceptional
24.5%
Natives/Alaskans
94.6
/100
|
#123
Exceptional
24.6%
Immigrants from South America
93.9
/100
|
#124
Exceptional
24.6%
Spanish Americans
93.8
/100
|
#125
Exceptional
24.6%

Immigrants from Micronesia Wage/Income Gap Correlation Summary

MeasurementImmigrants from Micronesia DataWage/Income Gap Data
Minimum0.022%5.7%
Maximum32.2%56.5%
Range32.1%50.8%
Mean4.8%28.1%
Median3.5%26.6%
Interquartile 25% (IQ1)1.6%21.6%
Interquartile 75% (IQ3)6.4%31.8%
Interquartile Range (IQR)4.8%10.1%
Standard Deviation (Sample)5.6%10.6%
Standard Deviation (Population)5.5%10.5%

Correlation Details

Immigrants from Micronesia PercentileSample SizeWage/Income Gap
[
0.0%
-
0.5%
]
0.022%
53,363,86721.9%
[
0.0%
-
0.5%
]
0.22%
3,463,82026.0%
[
0.0%
-
0.5%
]
0.39%
1,632,65025.5%
[
0.5%
-
1.0%
]
0.54%
911,21920.0%
[
0.5%
-
1.0%
]
0.73%
520,70228.4%
[
0.5%
-
1.0%
]
0.90%
465,45828.2%
[
1.0%
-
1.5%
]
1.05%
181,74624.8%
[
1.0%
-
1.5%
]
1.22%
79,62227.7%
[
1.0%
-
1.5%
]
1.35%
37,86831.4%
[
1.5%
-
2.0%
]
1.56%
130,25723.2%
[
1.5%
-
2.0%
]
1.63%
382,52421.4%
[
1.5%
-
2.0%
]
1.86%
10,98922.0%
[
1.5%
-
2.0%
]
1.95%
66711.5%
[
2.0%
-
2.5%
]
2.13%
133,47830.4%
[
2.0%
-
2.5%
]
2.33%
78,52624.3%
[
2.0%
-
2.5%
]
2.46%
1,90717.7%
[
2.5%
-
3.0%
]
2.59%
55,47320.3%
[
2.5%
-
3.0%
]
2.81%
3,70116.3%
[
2.5%
-
3.0%
]
2.99%
8,25429.8%
[
3.0%
-
3.5%
]
3.19%
58,74219.5%
[
3.0%
-
3.5%
]
3.48%
9,70238.0%
[
3.5%
-
4.0%
]
3.66%
9,38335.1%
[
3.5%
-
4.0%
]
3.79%
10,78624.1%
[
3.5%
-
4.0%
]
3.95%
11,20726.3%
[
4.0%
-
4.5%
]
4.17%
62435.2%
[
4.5%
-
5.0%
]
4.52%
1,12944.8%
[
4.5%
-
5.0%
]
4.87%
10,04225.6%
[
5.0%
-
5.5%
]
5.28%
1,93231.2%
[
5.0%
-
5.5%
]
5.31%
41426.6%
[
6.0%
-
6.5%
]
6.04%
84456.3%
[
6.0%
-
6.5%
]
6.28%
2,00527.0%
[
6.5%
-
7.0%
]
6.53%
3,47719.7%
[
7.0%
-
7.5%
]
7.14%
19656.5%
[
7.0%
-
7.5%
]
7.41%
8153.8%
[
7.5%
-
8.0%
]
7.87%
4,84217.2%
[
7.5%
-
8.0%
]
7.96%
5,39133.6%
[
8.0%
-
8.5%
]
8.05%
2,82035.1%
[
8.0%
-
8.5%
]
8.44%
37928.9%
[
8.5%
-
9.0%
]
9.00%
1,2785.7%
[
18.0%
-
18.5%
]
18.47%
69329.9%
[
32.0%
-
32.5%
]
32.16%
39832.1%