Immigrants from Austria GED/Equivalency
COMPARE
Immigrants from Austria
Select to Compare
GED/Equivalency
Immigrants from Austria GED/Equivalency
88.3%
GED/EQUIVALENCY
99.7/ 100
METRIC RATING
37th/ 347
METRIC RANK
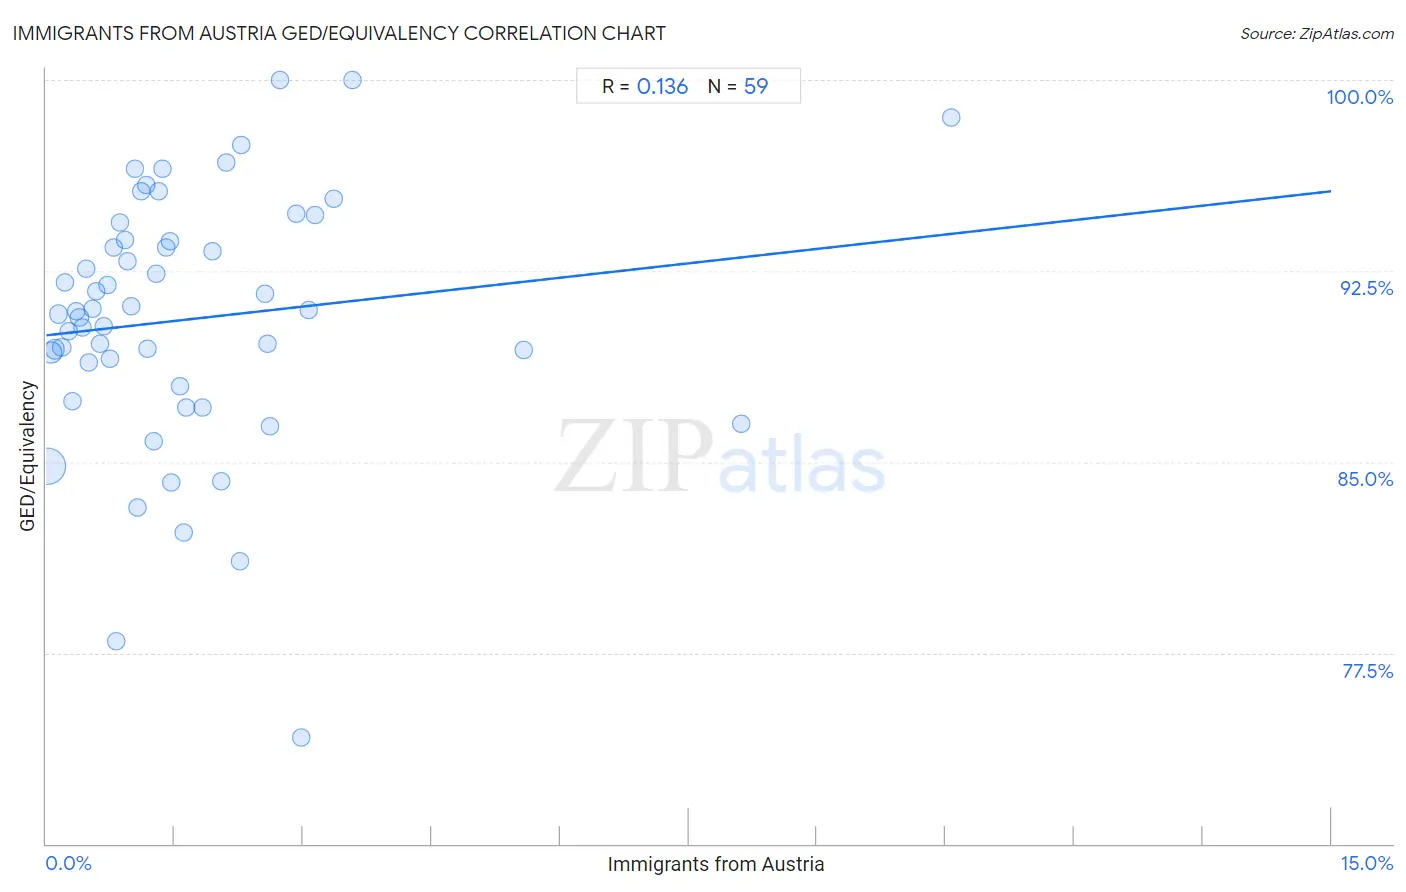
Immigrants from Austria GED/Equivalency Correlation Chart
The statistical analysis conducted on geographies consisting of 167,973,751 people shows a poor positive correlation between the proportion of Immigrants from Austria and percentage of population with at least ged/equivalency education in the United States with a correlation coefficient (R) of 0.136 and weighted average of 88.3%. On average, for every 1% (one percent) increase in Immigrants from Austria within a typical geography, there is an increase of 0.38% in percentage of population with at least ged/equivalency education.
It is essential to understand that the correlation between the percentage of Immigrants from Austria and percentage of population with at least ged/equivalency education does not imply a direct cause-and-effect relationship. It remains uncertain whether the presence of Immigrants from Austria influences an upward or downward trend in the level of percentage of population with at least ged/equivalency education within an area, or if Immigrants from Austria simply ended up residing in those areas with higher or lower levels of percentage of population with at least ged/equivalency education due to other factors.
Demographics Similar to Immigrants from Austria by GED/Equivalency
In terms of ged/equivalency, the demographic groups most similar to Immigrants from Austria are Immigrants from Belgium (88.3%, a difference of 0.030%), Burmese (88.3%, a difference of 0.030%), Immigrants from South Central Asia (88.4%, a difference of 0.050%), Immigrants from Japan (88.4%, a difference of 0.070%), and Immigrants from Sweden (88.4%, a difference of 0.080%).
| Demographics | Rating | Rank | GED/Equivalency |
| Turks | 99.8 /100 | #30 | Exceptional 88.5% |
| Bhutanese | 99.8 /100 | #31 | Exceptional 88.4% |
| Danes | 99.8 /100 | #32 | Exceptional 88.4% |
| Immigrants from Sweden | 99.7 /100 | #33 | Exceptional 88.4% |
| Immigrants from Japan | 99.7 /100 | #34 | Exceptional 88.4% |
| Immigrants from South Central Asia | 99.7 /100 | #35 | Exceptional 88.4% |
| Immigrants from Belgium | 99.7 /100 | #36 | Exceptional 88.3% |
| Immigrants from Austria | 99.7 /100 | #37 | Exceptional 88.3% |
| Burmese | 99.7 /100 | #38 | Exceptional 88.3% |
| Immigrants from Israel | 99.6 /100 | #39 | Exceptional 88.2% |
| Italians | 99.6 /100 | #40 | Exceptional 88.2% |
| Finns | 99.6 /100 | #41 | Exceptional 88.2% |
| Cambodians | 99.6 /100 | #42 | Exceptional 88.2% |
| Immigrants from Scotland | 99.6 /100 | #43 | Exceptional 88.2% |
| Macedonians | 99.5 /100 | #44 | Exceptional 88.1% |
Immigrants from Austria GED/Equivalency Correlation Summary
| Measurement | Immigrants from Austria Data | GED/Equivalency Data |
| Minimum | 0.018% | 74.2% |
| Maximum | 10.6% | 100.0% |
| Range | 10.6% | 25.8% |
| Mean | 1.7% | 90.6% |
| Median | 1.2% | 90.9% |
| Interquartile 25% (IQ1) | 0.59% | 88.0% |
| Interquartile 75% (IQ3) | 2.3% | 93.7% |
| Interquartile Range (IQR) | 1.7% | 5.7% |
| Standard Deviation (Sample) | 1.8% | 5.0% |
| Standard Deviation (Population) | 1.8% | 5.0% |
Correlation Details
| Immigrants from Austria Percentile | Sample Size | GED/Equivalency |
[ 0.0% - 0.5% ] 0.018% | 123,327,203 | 84.9% |
[ 0.0% - 0.5% ] 0.057% | 24,684,762 | 89.3% |
[ 0.0% - 0.5% ] 0.097% | 10,051,048 | 89.4% |
[ 0.0% - 0.5% ] 0.14% | 3,684,068 | 90.8% |
[ 0.0% - 0.5% ] 0.18% | 2,164,490 | 89.5% |
[ 0.0% - 0.5% ] 0.22% | 961,976 | 92.0% |
[ 0.0% - 0.5% ] 0.26% | 826,042 | 90.1% |
[ 0.0% - 0.5% ] 0.30% | 561,151 | 87.4% |
[ 0.0% - 0.5% ] 0.34% | 362,368 | 90.9% |
[ 0.0% - 0.5% ] 0.39% | 233,558 | 90.7% |
[ 0.0% - 0.5% ] 0.42% | 260,444 | 90.3% |
[ 0.0% - 0.5% ] 0.46% | 153,196 | 92.6% |
[ 0.5% - 1.0% ] 0.50% | 87,062 | 88.9% |
[ 0.5% - 1.0% ] 0.55% | 94,156 | 91.0% |
[ 0.5% - 1.0% ] 0.59% | 66,013 | 91.7% |
[ 0.5% - 1.0% ] 0.63% | 52,814 | 89.6% |
[ 0.5% - 1.0% ] 0.68% | 53,831 | 90.3% |
[ 0.5% - 1.0% ] 0.72% | 76,693 | 92.0% |
[ 0.5% - 1.0% ] 0.74% | 7,803 | 89.0% |
[ 0.5% - 1.0% ] 0.79% | 12,498 | 93.4% |
[ 0.5% - 1.0% ] 0.82% | 19,488 | 78.0% |
[ 0.5% - 1.0% ] 0.87% | 61,067 | 94.4% |
[ 0.5% - 1.0% ] 0.92% | 12,878 | 93.7% |
[ 0.5% - 1.0% ] 0.95% | 15,145 | 92.9% |
[ 0.5% - 1.0% ] 1.00% | 15,840 | 91.1% |
[ 1.0% - 1.5% ] 1.04% | 6,445 | 96.5% |
[ 1.0% - 1.5% ] 1.06% | 30,370 | 83.2% |
[ 1.0% - 1.5% ] 1.11% | 5,744 | 95.6% |
[ 1.0% - 1.5% ] 1.17% | 2,823 | 95.9% |
[ 1.0% - 1.5% ] 1.18% | 3,551 | 89.4% |
[ 1.0% - 1.5% ] 1.25% | 1,598 | 85.8% |
[ 1.0% - 1.5% ] 1.28% | 13,251 | 92.4% |
[ 1.0% - 1.5% ] 1.31% | 4,879 | 95.6% |
[ 1.0% - 1.5% ] 1.36% | 2,135 | 96.5% |
[ 1.0% - 1.5% ] 1.40% | 4,204 | 93.4% |
[ 1.0% - 1.5% ] 1.45% | 4,555 | 93.7% |
[ 1.0% - 1.5% ] 1.47% | 16,026 | 84.2% |
[ 1.5% - 2.0% ] 1.57% | 5,871 | 88.0% |
[ 1.5% - 2.0% ] 1.61% | 2,863 | 82.2% |
[ 1.5% - 2.0% ] 1.63% | 1,533 | 87.1% |
[ 1.5% - 2.0% ] 1.82% | 713 | 87.1% |
[ 1.5% - 2.0% ] 1.94% | 360 | 93.3% |
[ 2.0% - 2.5% ] 2.04% | 1,424 | 84.3% |
[ 2.0% - 2.5% ] 2.10% | 143 | 96.7% |
[ 2.0% - 2.5% ] 2.26% | 133 | 81.1% |
[ 2.0% - 2.5% ] 2.27% | 3,344 | 97.4% |
[ 2.5% - 3.0% ] 2.55% | 1,685 | 91.6% |
[ 2.5% - 3.0% ] 2.59% | 5,406 | 89.6% |
[ 2.5% - 3.0% ] 2.61% | 537 | 86.4% |
[ 2.5% - 3.0% ] 2.73% | 110 | 100.0% |
[ 2.5% - 3.0% ] 2.92% | 274 | 94.8% |
[ 2.5% - 3.0% ] 2.97% | 101 | 74.2% |
[ 3.0% - 3.5% ] 3.06% | 4,318 | 91.0% |
[ 3.0% - 3.5% ] 3.14% | 2,324 | 94.7% |
[ 3.0% - 3.5% ] 3.36% | 268 | 95.3% |
[ 3.5% - 4.0% ] 3.57% | 420 | 100.0% |
[ 5.5% - 6.0% ] 5.58% | 466 | 89.4% |
[ 8.0% - 8.5% ] 8.11% | 37 | 86.5% |
[ 10.5% - 11.0% ] 10.57% | 246 | 98.5% |