Immigrants from Austria Wage/Income Gap

COMPARE

Immigrants from Austria
Race
Ancestry
AfghanAfricanAlaska NativeAlaskan AthabascanAlbanianAleutAlsatianAmericanApacheArabArapahoArgentineanArmenianAssyrian/Chaldean/SyriacAustralianAustrianBahamianBangladeshiBarbadianBasqueBelgianBelizeanBermudanBhutaneseBlackfeetBolivianBrazilianBritishBritish West IndianBulgarianBurmeseCajunCambodianCanadianCape VerdeanCarpatho RusynCelticCentral AmericanCentral American IndianCherokeeCheyenneChickasawChileanChineseChippewaChoctawColombianColvilleComancheCosta RicanCreeCreekCroatianCrowCubanCypriotCzechCzechoslovakianDanishDelawareDominicanDutchDutch West IndianEastern EuropeanEcuadorianEgyptianEnglishEstonianEthiopianEuropeanFijianFilipinoFinnishFrenchFrench American IndianFrench CanadianGermanGerman RussianGhanaianGreekGuamanian/ChamorroGuatemalanGuyaneseHaitianHmongHonduranHopiHoumaHungarianIcelanderIndian (Asian)IndonesianInupiatIranianIraqiIrishIroquoisIsraeliItalianJamaicanJapaneseJordanianKenyanKiowaKoreanLaotianLatvianLebaneseLiberianLithuanianLumbeeLuxembourgerMacedonianMalaysianMalteseMarshalleseMenomineeMexicanMexican American IndianMongolianMoroccanNative HawaiianNavajoNepaleseNew ZealanderNicaraguanNigerianNorthern EuropeanNorwegianOkinawanOsageOttawaPaiutePakistaniPalestinianPanamanianParaguayanPennsylvania GermanPeruvianPimaPolishPortuguesePotawatomiPuebloPuerto RicanPuget Sound SalishRomanianRussianSalvadoranSamoanScandinavianScotch-IrishScottishSeminoleSenegaleseSerbianShoshoneSierra LeoneanSiouxSlavicSlovakSloveneSomaliSouth AfricanSouth AmericanSouth American IndianSoviet UnionSpaniardSpanishSpanish AmericanSpanish American IndianSri LankanSubsaharan AfricanSudaneseSwedishSwissSyrianTaiwaneseThaiTlingit-HaidaTohono O'OdhamTonganTrinidadian and TobagonianTsimshianTurkishU.S. Virgin IslanderUgandanUkrainianUruguayanUteVenezuelanVietnameseWelshWest IndianYakamaYaquiYugoslavianYumanYup'ikZimbabwean
Immigration
NonimmigrantsImmigrantsAfghanistanAfricaAlbaniaArgentinaArmeniaAsiaAustraliaAustriaBahamasBangladeshBarbadosBelarusBelgiumBelizeBoliviaBosnia and HerzegovinaBrazilBulgariaBurma/MyanmarCabo VerdeCambodiaCameroonCanadaCaribbeanCentral AmericaChileChinaColombiaCongoCosta RicaCroatiaCubaCzechoslovakiaDenmarkDominicaDominican RepublicEastern AfricaEastern AsiaEastern EuropeEcuadorEgyptEl SalvadorEnglandEritreaEthiopiaEuropeFijiFranceGermanyGhanaGreeceGrenadaGuatemalaGuyanaHaitiHondurasHong KongHungaryIndiaIndonesiaIranIraqIrelandIsraelItalyJamaicaJapanJordanKazakhstanKenyaKoreaKuwaitLaosLatin AmericaLatviaLebanonLiberiaLithuaniaMalaysiaMexicoMicronesiaMiddle AfricaMoldovaMoroccoNepalNetherlandsNicaraguaNigeriaNorth AmericaNorth MacedoniaNorthern AfricaNorthern EuropeNorwayOceaniaPakistanPanamaPeruPhilippinesPolandPortugalRomaniaRussiaSaudi ArabiaScotlandSenegalSerbiaSierra LeoneSingaporeSomaliaSouth AfricaSouth AmericaSouth Central AsiaSouth Eastern AsiaSouthern EuropeSpainSri LankaSt. Vincent and the GrenadinesSudanSwedenSwitzerlandSyriaTaiwanThailandTrinidad and TobagoTurkeyUgandaUkraineUruguayUzbekistanVenezuelaVietnamWest IndiesWestern AfricaWestern AsiaWestern EuropeYemenZaireZimbabweAzores
Select to Compare
Race
Ancestry
AfghanAfricanAlaska NativeAlaskan AthabascanAlbanianAleutAlsatianAmericanApacheArabArapahoArgentineanArmenianAssyrian/Chaldean/SyriacAustralianAustrianBahamianBangladeshiBarbadianBasqueBelgianBelizeanBermudanBhutaneseBlackfeetBolivianBrazilianBritishBritish West IndianBulgarianBurmeseCajunCambodianCanadianCape VerdeanCarpatho RusynCelticCentral AmericanCentral American IndianCherokeeCheyenneChickasawChileanChineseChippewaChoctawColombianColvilleComancheCosta RicanCreeCreekCroatianCrowCubanCypriotCzechCzechoslovakianDanishDelawareDominicanDutchDutch West IndianEastern EuropeanEcuadorianEgyptianEnglishEstonianEthiopianEuropeanFijianFilipinoFinnishFrenchFrench American IndianFrench CanadianGermanGerman RussianGhanaianGreekGuamanian/ChamorroGuatemalanGuyaneseHaitianHmongHonduranHopiHoumaHungarianIcelanderIndian (Asian)IndonesianInupiatIranianIraqiIrishIroquoisIsraeliItalianJamaicanJapaneseJordanianKenyanKiowaKoreanLaotianLatvianLebaneseLiberianLithuanianLumbeeLuxembourgerMacedonianMalaysianMalteseMarshalleseMenomineeMexicanMexican American IndianMongolianMoroccanNative HawaiianNavajoNepaleseNew ZealanderNicaraguanNigerianNorthern EuropeanNorwegianOkinawanOsageOttawaPaiutePakistaniPalestinianPanamanianParaguayanPennsylvania GermanPeruvianPimaPolishPortuguesePotawatomiPuebloPuerto RicanPuget Sound SalishRomanianRussianSalvadoranSamoanScandinavianScotch-IrishScottishSeminoleSenegaleseSerbianShoshoneSierra LeoneanSiouxSlavicSlovakSloveneSomaliSouth AfricanSouth AmericanSouth American IndianSoviet UnionSpaniardSpanishSpanish AmericanSpanish American IndianSri LankanSubsaharan AfricanSudaneseSwedishSwissSyrianTaiwaneseThaiTlingit-HaidaTohono O'OdhamTonganTrinidadian and TobagonianTsimshianTurkishU.S. Virgin IslanderUgandanUkrainianUruguayanUteVenezuelanVietnameseWelshWest IndianYakamaYaquiYugoslavianYumanYup'ikZimbabwean
Immigration
NonimmigrantsImmigrantsAfghanistanAfricaAlbaniaArgentinaArmeniaAsiaAustraliaBahamasBangladeshBarbadosBelarusBelgiumBelizeBoliviaBosnia and HerzegovinaBrazilBulgariaBurma/MyanmarCabo VerdeCambodiaCameroonCanadaCaribbeanCentral AmericaChileChinaColombiaCongoCosta RicaCroatiaCubaCzechoslovakiaDenmarkDominicaDominican RepublicEastern AfricaEastern AsiaEastern EuropeEcuadorEgyptEl SalvadorEnglandEritreaEthiopiaEuropeFijiFranceGermanyGhanaGreeceGrenadaGuatemalaGuyanaHaitiHondurasHong KongHungaryIndiaIndonesiaIranIraqIrelandIsraelItalyJamaicaJapanJordanKazakhstanKenyaKoreaKuwaitLaosLatin AmericaLatviaLebanonLiberiaLithuaniaMalaysiaMexicoMicronesiaMiddle AfricaMoldovaMoroccoNepalNetherlandsNicaraguaNigeriaNorth AmericaNorth MacedoniaNorthern AfricaNorthern EuropeNorwayOceaniaPakistanPanamaPeruPhilippinesPolandPortugalRomaniaRussiaSaudi ArabiaScotlandSenegalSerbiaSierra LeoneSingaporeSomaliaSouth AfricaSouth AmericaSouth Central AsiaSouth Eastern AsiaSouthern EuropeSpainSri LankaSt. Vincent and the GrenadinesSudanSwedenSwitzerlandSyriaTaiwanThailandTrinidad and TobagoTurkeyUgandaUkraineUruguayUzbekistanVenezuelaVietnamWest IndiesWestern AfricaWestern AsiaWestern EuropeYemenZaireZimbabweAzores
Wage/Income Gap
Income
Poverty
Unemployment
Labor Participation
Family Structure
Vehicle Availability
Education Level
Disability

Immigrants from Austria Wage/Income Gap
Tragic

28.1%
WAGE/INCOME GAP
0.4/ 100
METRIC RATING
286th/ 347
METRIC RANK

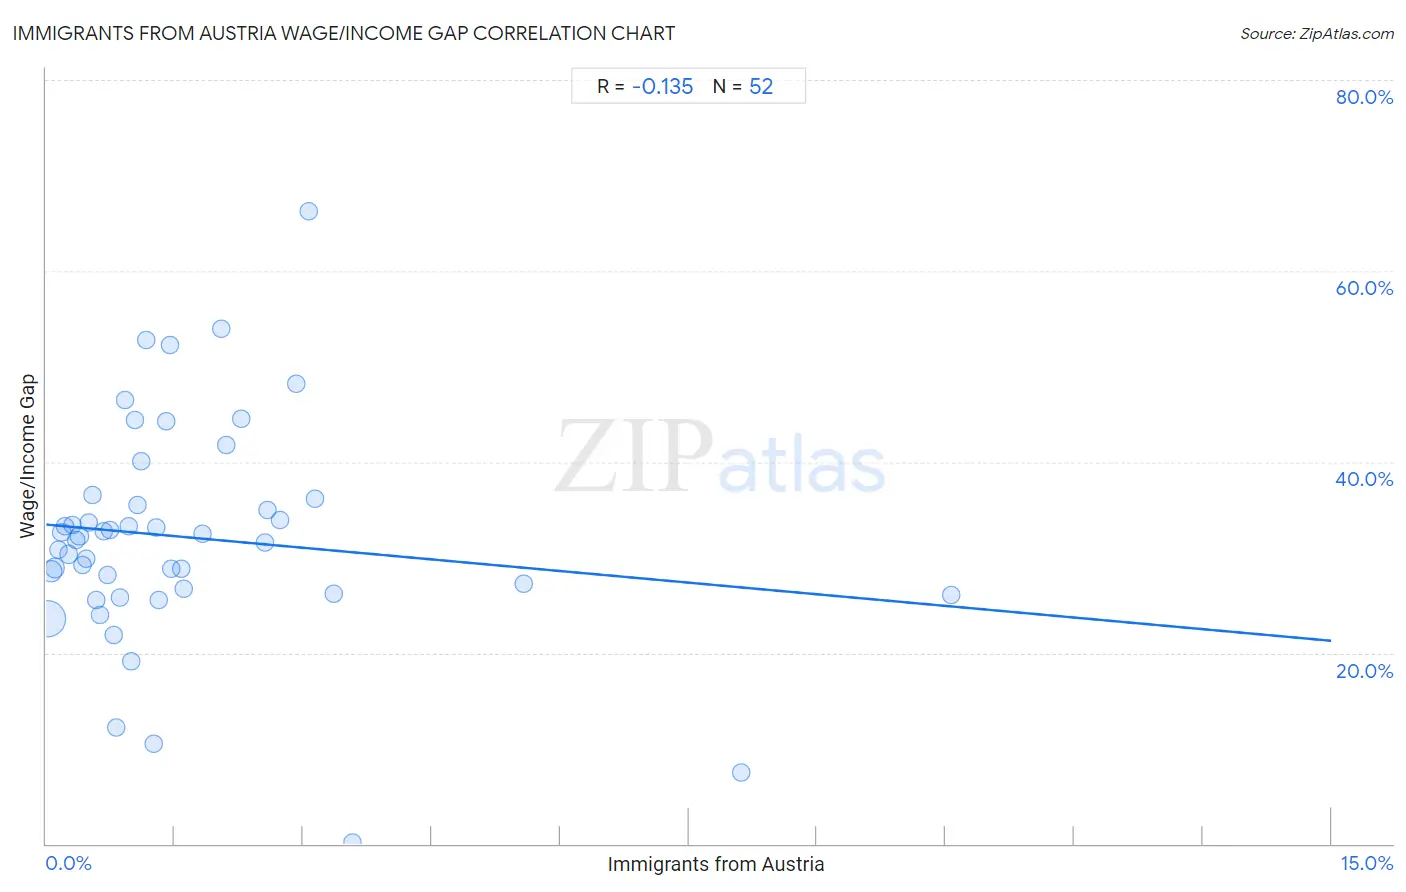
Immigrants from Austria Wage/Income Gap Correlation Chart

The statistical analysis conducted on geographies consisting of 167,902,173 people shows a poor negative correlation between the proportion of Immigrants from Austria and wage/income gap percentage in the United States with a correlation coefficient (R) of -0.135 and weighted average of 28.1%. On average, for every 1% (one percent) increase in Immigrants from Austria within a typical geography, there is a decrease of 0.81% in wage/income gap percentage.
Immigrants from Austria Wage/Income Gap
It is essential to understand that the correlation between the percentage of Immigrants from Austria and wage/income gap percentage does not imply a direct cause-and-effect relationship. It remains uncertain whether the presence of Immigrants from Austria influences an upward or downward trend in the level of wage/income gap percentage within an area, or if Immigrants from Austria simply ended up residing in those areas with higher or lower levels of wage/income gap percentage due to other factors.

Demographics Similar to Immigrants from Austria by Wage/Income Gap

In terms of wage/income gap, the demographic groups most similar to Immigrants from Austria are Italian (28.1%, a difference of 0.030%), Okinawan (28.1%, a difference of 0.040%), Choctaw (28.1%, a difference of 0.070%), Canadian (28.1%, a difference of 0.11%), and Immigrants from Sweden (28.1%, a difference of 0.16%).
DemographicsRating | RankWage/Income Gap
Romanians
0.5
/100
|
#279
Tragic
28.0%
Russians
0.5
/100
|
#280
Tragic
28.0%
Burmese
0.5
/100
|
#281
Tragic
28.0%
South Africans
0.5
/100
|
#282
Tragic
28.0%
French Canadians
0.4
/100
|
#283
Tragic
28.1%
Immigrants from Sweden
0.4
/100
|
#284
Tragic
28.1%
Italians
0.4
/100
|
#285
Tragic
28.1%
Immigrants from Austria
0.4
/100
|
#286
Tragic
28.1%
Okinawans
0.4
/100
|
#287
Tragic
28.1%
Choctaw
0.4
/100
|
#288
Tragic
28.1%
Canadians
0.3
/100
|
#289
Tragic
28.1%
Australians
0.3
/100
|
#290
Tragic
28.2%
Czechoslovakians
0.3
/100
|
#291
Tragic
28.2%
Immigrants from Australia
0.3
/100
|
#292
Tragic
28.2%
Immigrants from Israel
0.3
/100
|
#293
Tragic
28.2%

Immigrants from Austria Wage/Income Gap Correlation Summary

MeasurementImmigrants from Austria DataWage/Income Gap Data
Minimum0.018%0.18%
Maximum10.6%66.3%
Range10.6%66.1%
Mean1.6%32.1%
Median1.1%32.1%
Interquartile 25% (IQ1)0.52%26.4%
Interquartile 75% (IQ3)2.1%35.9%
Interquartile Range (IQR)1.5%9.4%
Standard Deviation (Sample)1.9%11.6%
Standard Deviation (Population)1.9%11.5%

Correlation Details

Immigrants from Austria PercentileSample SizeWage/Income Gap
[
0.0%
-
0.5%
]
0.018%
123,327,20323.6%
[
0.0%
-
0.5%
]
0.057%
24,684,76228.5%
[
0.0%
-
0.5%
]
0.097%
10,051,04828.9%
[
0.0%
-
0.5%
]
0.14%
3,684,06830.8%
[
0.0%
-
0.5%
]
0.18%
2,164,49032.6%
[
0.0%
-
0.5%
]
0.22%
960,18733.3%
[
0.0%
-
0.5%
]
0.26%
821,70530.3%
[
0.0%
-
0.5%
]
0.30%
558,42833.4%
[
0.0%
-
0.5%
]
0.34%
355,72531.9%
[
0.0%
-
0.5%
]
0.39%
233,55832.3%
[
0.0%
-
0.5%
]
0.42%
258,40629.2%
[
0.0%
-
0.5%
]
0.46%
151,02629.8%
[
0.5%
-
1.0%
]
0.50%
84,89633.6%
[
0.5%
-
1.0%
]
0.55%
92,49336.5%
[
0.5%
-
1.0%
]
0.59%
58,51025.6%
[
0.5%
-
1.0%
]
0.63%
50,13524.0%
[
0.5%
-
1.0%
]
0.68%
52,79132.7%
[
0.5%
-
1.0%
]
0.72%
72,91228.2%
[
0.5%
-
1.0%
]
0.74%
7,27132.9%
[
0.5%
-
1.0%
]
0.79%
6,59121.9%
[
0.5%
-
1.0%
]
0.82%
19,48812.1%
[
0.5%
-
1.0%
]
0.87%
61,06725.7%
[
0.5%
-
1.0%
]
0.91%
8,96646.4%
[
0.5%
-
1.0%
]
0.96%
7,18833.2%
[
0.5%
-
1.0%
]
1.00%
15,84019.1%
[
1.0%
-
1.5%
]
1.04%
6,44544.4%
[
1.0%
-
1.5%
]
1.06%
29,34035.5%
[
1.0%
-
1.5%
]
1.11%
5,74440.0%
[
1.0%
-
1.5%
]
1.17%
2,82352.8%
[
1.0%
-
1.5%
]
1.25%
1,59810.5%
[
1.0%
-
1.5%
]
1.28%
13,25133.1%
[
1.0%
-
1.5%
]
1.31%
1,90525.5%
[
1.0%
-
1.5%
]
1.40%
4,13344.2%
[
1.0%
-
1.5%
]
1.45%
4,55552.3%
[
1.0%
-
1.5%
]
1.47%
16,02628.8%
[
1.5%
-
2.0%
]
1.58%
4,19028.8%
[
1.5%
-
2.0%
]
1.61%
2,61526.7%
[
1.5%
-
2.0%
]
1.82%
32932.5%
[
2.0%
-
2.5%
]
2.04%
1,42454.0%
[
2.0%
-
2.5%
]
2.10%
14341.7%
[
2.0%
-
2.5%
]
2.27%
3,34444.5%
[
2.5%
-
3.0%
]
2.55%
1,68531.6%
[
2.5%
-
3.0%
]
2.59%
5,40635.0%
[
2.5%
-
3.0%
]
2.73%
11033.9%
[
2.5%
-
3.0%
]
2.92%
27448.2%
[
3.0%
-
3.5%
]
3.06%
4,31866.3%
[
3.0%
-
3.5%
]
3.14%
2,32436.2%
[
3.0%
-
3.5%
]
3.36%
26826.1%
[
3.5%
-
4.0%
]
3.57%
4200.18%
[
5.5%
-
6.0%
]
5.58%
46627.2%
[
8.0%
-
8.5%
]
8.11%
377.5%
[
10.5%
-
11.0%
]
10.57%
24626.0%