Finnish College, Under 1 year
COMPARE
Finnish
Select to Compare
College, Under 1 year
Finnish College, Under 1 year
66.9%
COLLEGE, UNDER 1 YEAR
88.6/ 100
METRIC RATING
131st/ 347
METRIC RANK
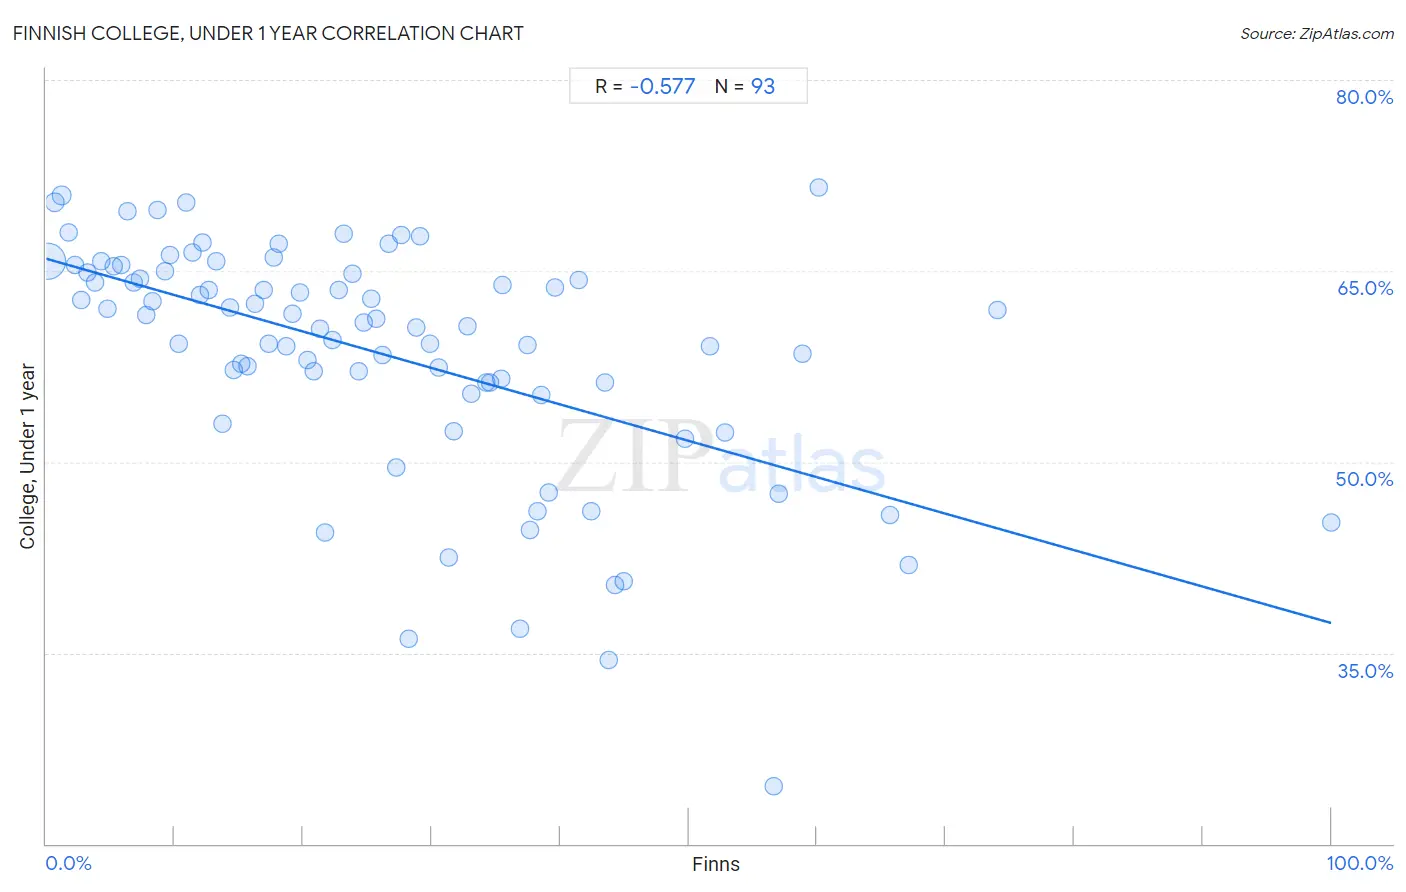
Finnish College, Under 1 year Correlation Chart
The statistical analysis conducted on geographies consisting of 404,673,530 people shows a substantial negative correlation between the proportion of Finns and percentage of population with at least college, under 1 year education in the United States with a correlation coefficient (R) of -0.577 and weighted average of 66.9%. On average, for every 1% (one percent) increase in Finns within a typical geography, there is a decrease of 0.29% in percentage of population with at least college, under 1 year education.
It is essential to understand that the correlation between the percentage of Finns and percentage of population with at least college, under 1 year education does not imply a direct cause-and-effect relationship. It remains uncertain whether the presence of Finns influences an upward or downward trend in the level of percentage of population with at least college, under 1 year education within an area, or if Finns simply ended up residing in those areas with higher or lower levels of percentage of population with at least college, under 1 year education due to other factors.
Demographics Similar to Finns by College, Under 1 year
In terms of college, under 1 year, the demographic groups most similar to Finns are Polish (66.9%, a difference of 0.020%), Immigrants from Brazil (66.9%, a difference of 0.030%), Immigrants from Syria (66.9%, a difference of 0.040%), Iraqi (66.8%, a difference of 0.060%), and Canadian (66.8%, a difference of 0.070%).
| Demographics | Rating | Rank | College, Under 1 year |
| Arabs | 92.6 /100 | #124 | Exceptional 67.2% |
| Italians | 91.8 /100 | #125 | Exceptional 67.2% |
| Alsatians | 91.3 /100 | #126 | Exceptional 67.1% |
| Czechs | 90.8 /100 | #127 | Exceptional 67.1% |
| Scottish | 90.2 /100 | #128 | Exceptional 67.0% |
| Immigrants from Eastern Africa | 89.5 /100 | #129 | Excellent 67.0% |
| Immigrants from Syria | 89.0 /100 | #130 | Excellent 66.9% |
| Finns | 88.6 /100 | #131 | Excellent 66.9% |
| Poles | 88.4 /100 | #132 | Excellent 66.9% |
| Immigrants from Brazil | 88.3 /100 | #133 | Excellent 66.9% |
| Iraqis | 88.0 /100 | #134 | Excellent 66.8% |
| Canadians | 87.9 /100 | #135 | Excellent 66.8% |
| Ugandans | 87.8 /100 | #136 | Excellent 66.8% |
| Immigrants from Chile | 87.4 /100 | #137 | Excellent 66.8% |
| Immigrants from Italy | 86.9 /100 | #138 | Excellent 66.8% |
Finnish College, Under 1 year Correlation Summary
| Measurement | Finnish Data | College, Under 1 year Data |
| Minimum | 0.14% | 24.5% |
| Maximum | 100.0% | 71.6% |
| Range | 99.9% | 47.0% |
| Mean | 26.0% | 58.5% |
| Median | 23.1% | 60.9% |
| Interquartile 25% (IQ1) | 11.6% | 55.8% |
| Interquartile 75% (IQ3) | 37.2% | 64.9% |
| Interquartile Range (IQR) | 25.5% | 9.1% |
| Standard Deviation (Sample) | 18.7% | 9.3% |
| Standard Deviation (Population) | 18.6% | 9.2% |
Correlation Details
| Finnish Percentile | Sample Size | College, Under 1 year |
[ 0.0% - 0.5% ] 0.14% | 357,766,069 | 65.8% |
[ 0.5% - 1.0% ] 0.68% | 31,805,644 | 70.4% |
[ 1.0% - 1.5% ] 1.20% | 8,203,889 | 70.9% |
[ 1.5% - 2.0% ] 1.70% | 2,766,062 | 68.0% |
[ 2.0% - 2.5% ] 2.24% | 1,193,552 | 65.4% |
[ 2.5% - 3.0% ] 2.75% | 622,875 | 62.7% |
[ 3.0% - 3.5% ] 3.25% | 488,396 | 64.9% |
[ 3.5% - 4.0% ] 3.79% | 183,133 | 64.1% |
[ 4.0% - 4.5% ] 4.25% | 260,185 | 65.7% |
[ 4.5% - 5.0% ] 4.79% | 100,321 | 62.1% |
[ 5.0% - 5.5% ] 5.30% | 87,659 | 65.3% |
[ 5.5% - 6.0% ] 5.79% | 147,631 | 65.5% |
[ 6.0% - 6.5% ] 6.28% | 179,037 | 69.7% |
[ 6.5% - 7.0% ] 6.81% | 78,398 | 64.1% |
[ 7.0% - 7.5% ] 7.29% | 74,843 | 64.4% |
[ 7.5% - 8.0% ] 7.74% | 35,717 | 61.5% |
[ 8.0% - 8.5% ] 8.25% | 40,772 | 62.6% |
[ 8.5% - 9.0% ] 8.69% | 56,100 | 69.8% |
[ 9.0% - 9.5% ] 9.21% | 38,656 | 64.9% |
[ 9.5% - 10.0% ] 9.62% | 30,043 | 66.3% |
[ 10.0% - 10.5% ] 10.30% | 34,404 | 59.3% |
[ 10.5% - 11.0% ] 10.87% | 70,961 | 70.4% |
[ 11.0% - 11.5% ] 11.36% | 36,803 | 66.5% |
[ 11.5% - 12.0% ] 11.92% | 48,881 | 63.1% |
[ 12.0% - 12.5% ] 12.17% | 27,004 | 67.3% |
[ 12.5% - 13.0% ] 12.66% | 18,363 | 63.5% |
[ 13.0% - 13.5% ] 13.18% | 10,733 | 65.8% |
[ 13.5% - 14.0% ] 13.69% | 9,432 | 53.0% |
[ 14.0% - 14.5% ] 14.26% | 14,891 | 62.2% |
[ 14.5% - 15.0% ] 14.62% | 12,836 | 57.2% |
[ 15.0% - 15.5% ] 15.18% | 5,750 | 57.7% |
[ 15.5% - 16.0% ] 15.68% | 2,793 | 57.5% |
[ 16.0% - 16.5% ] 16.29% | 4,009 | 62.4% |
[ 16.5% - 17.0% ] 16.88% | 10,522 | 63.5% |
[ 17.0% - 17.5% ] 17.33% | 13,116 | 59.3% |
[ 17.5% - 18.0% ] 17.73% | 11,318 | 66.0% |
[ 18.0% - 18.5% ] 18.09% | 8,089 | 67.1% |
[ 18.5% - 19.0% ] 18.67% | 4,563 | 59.1% |
[ 19.0% - 19.5% ] 19.20% | 14,578 | 61.6% |
[ 19.5% - 20.0% ] 19.75% | 8,540 | 63.3% |
[ 20.0% - 20.5% ] 20.29% | 12,833 | 58.0% |
[ 20.5% - 21.0% ] 20.81% | 10,220 | 57.1% |
[ 21.0% - 21.5% ] 21.28% | 7,553 | 60.4% |
[ 21.5% - 22.0% ] 21.65% | 194 | 44.4% |
[ 22.0% - 22.5% ] 22.27% | 7,984 | 59.5% |
[ 22.5% - 23.0% ] 22.79% | 3,660 | 63.5% |
[ 23.0% - 23.5% ] 23.13% | 2,309 | 67.9% |
[ 23.5% - 24.0% ] 23.81% | 11,384 | 64.8% |
[ 24.0% - 24.5% ] 24.29% | 2,697 | 57.1% |
[ 24.5% - 25.0% ] 24.70% | 19,575 | 60.9% |
[ 25.0% - 25.5% ] 25.25% | 5,121 | 62.8% |
[ 25.5% - 26.0% ] 25.70% | 2,673 | 61.3% |
[ 26.0% - 26.5% ] 26.16% | 2,420 | 58.4% |
[ 26.5% - 27.0% ] 26.64% | 9,910 | 67.1% |
[ 27.0% - 27.5% ] 27.26% | 2,781 | 49.6% |
[ 27.5% - 28.0% ] 27.66% | 3,012 | 67.8% |
[ 28.0% - 28.5% ] 28.23% | 889 | 36.1% |
[ 28.5% - 29.0% ] 28.76% | 3,477 | 60.6% |
[ 29.0% - 29.5% ] 29.06% | 2,780 | 67.7% |
[ 29.5% - 30.0% ] 29.83% | 10,754 | 59.3% |
[ 30.5% - 31.0% ] 30.58% | 896 | 57.5% |
[ 31.0% - 31.5% ] 31.33% | 664 | 42.5% |
[ 31.5% - 32.0% ] 31.67% | 300 | 52.4% |
[ 32.5% - 33.0% ] 32.76% | 7,945 | 60.7% |
[ 33.0% - 33.5% ] 33.11% | 1,063 | 55.4% |
[ 34.0% - 34.5% ] 34.27% | 356 | 56.2% |
[ 34.5% - 35.0% ] 34.55% | 301 | 56.2% |
[ 35.0% - 35.5% ] 35.39% | 1,003 | 56.6% |
[ 35.5% - 36.0% ] 35.51% | 780 | 63.9% |
[ 36.5% - 37.0% ] 36.90% | 393 | 36.9% |
[ 37.0% - 37.5% ] 37.40% | 1,179 | 59.2% |
[ 37.5% - 38.0% ] 37.67% | 223 | 44.6% |
[ 38.0% - 38.5% ] 38.28% | 1,382 | 46.1% |
[ 38.5% - 39.0% ] 38.51% | 509 | 55.2% |
[ 39.0% - 39.5% ] 39.13% | 69 | 47.6% |
[ 39.5% - 40.0% ] 39.59% | 1,119 | 63.7% |
[ 41.0% - 41.5% ] 41.47% | 516 | 64.3% |
[ 42.0% - 42.5% ] 42.40% | 1,198 | 46.2% |
[ 43.0% - 43.5% ] 43.49% | 499 | 56.2% |
[ 43.5% - 44.0% ] 43.78% | 201 | 34.4% |
[ 44.0% - 44.5% ] 44.23% | 312 | 40.3% |
[ 44.5% - 45.0% ] 44.95% | 109 | 40.7% |
[ 49.5% - 50.0% ] 49.75% | 396 | 51.8% |
[ 51.5% - 52.0% ] 51.65% | 273 | 59.1% |
[ 52.5% - 53.0% ] 52.80% | 2,072 | 52.3% |
[ 56.5% - 57.0% ] 56.59% | 129 | 24.5% |
[ 57.0% - 57.5% ] 57.04% | 277 | 47.5% |
[ 58.5% - 59.0% ] 58.88% | 107 | 58.5% |
[ 60.0% - 60.5% ] 60.15% | 133 | 71.6% |
[ 65.5% - 66.0% ] 65.69% | 137 | 45.9% |
[ 67.0% - 67.5% ] 67.12% | 73 | 41.9% |
[ 74.0% - 74.5% ] 74.07% | 27 | 61.9% |
[ 99.5% - 100.0% ] 100.00% | 95 | 45.3% |