Finnish Female Disability
COMPARE
Finnish
Select to Compare
Female Disability
Finnish Female Disability
12.8%
DISABILITY | FEMALES
0.4/ 100
METRIC RATING
266th/ 347
METRIC RANK
Finnish Female Disability Correlation Chart
The statistical analysis conducted on geographies consisting of 404,612,195 people shows a weak positive correlation between the proportion of Finns and percentage of females with a disability in the United States with a correlation coefficient (R) of 0.289 and weighted average of 12.8%. On average, for every 1% (one percent) increase in Finns within a typical geography, there is an increase of 0.10% in percentage of females with a disability.
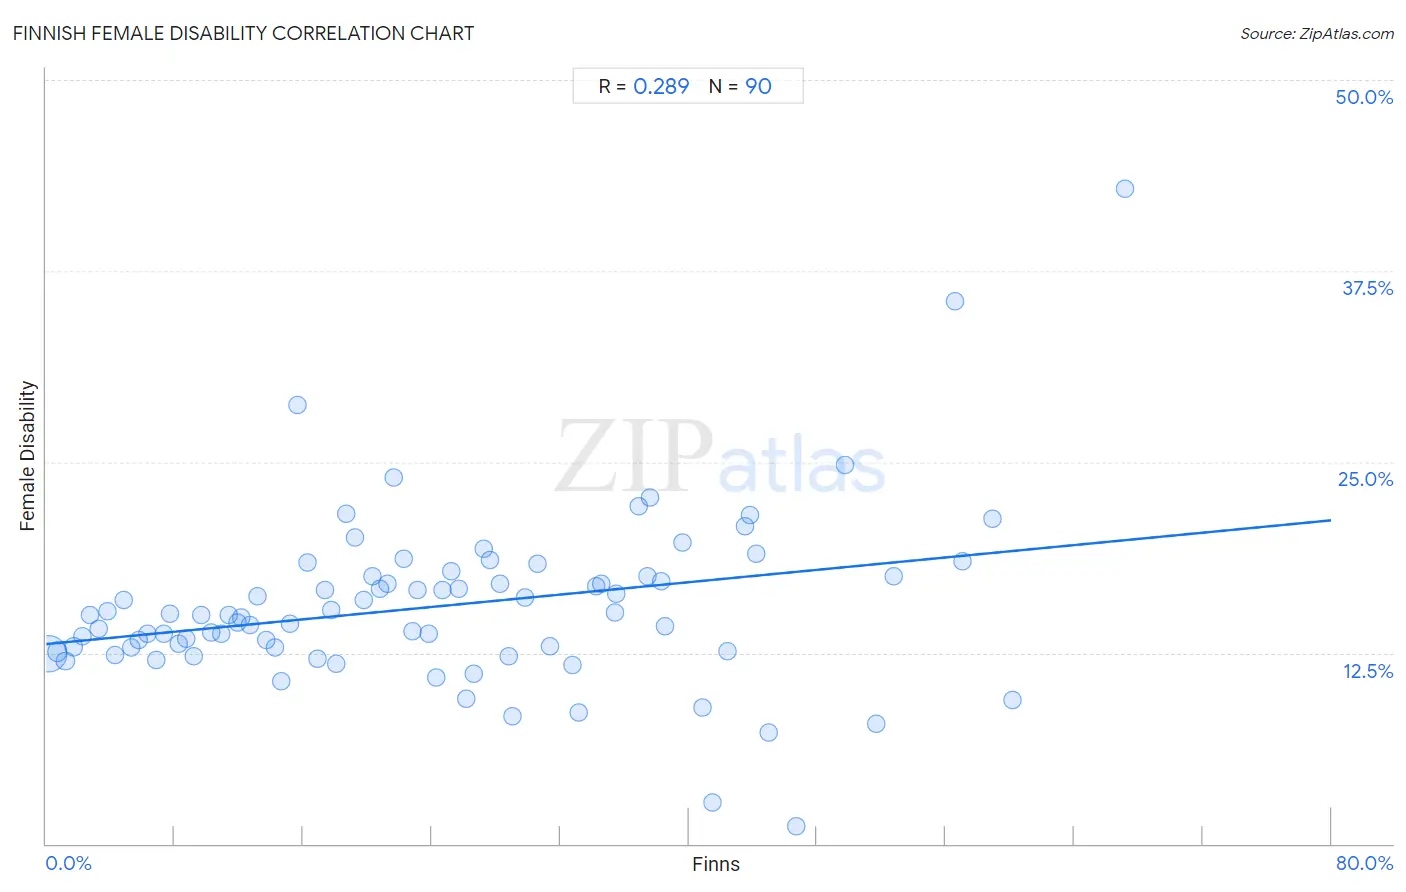
It is essential to understand that the correlation between the percentage of Finns and percentage of females with a disability does not imply a direct cause-and-effect relationship. It remains uncertain whether the presence of Finns influences an upward or downward trend in the level of percentage of females with a disability within an area, or if Finns simply ended up residing in those areas with higher or lower levels of percentage of females with a disability due to other factors.
Demographics Similar to Finns by Female Disability
In terms of female disability, the demographic groups most similar to Finns are Senegalese (12.8%, a difference of 0.020%), Immigrants from Laos (12.8%, a difference of 0.040%), Indonesian (12.8%, a difference of 0.10%), West Indian (12.8%, a difference of 0.12%), and Immigrants from Liberia (12.9%, a difference of 0.28%).
| Demographics | Rating | Rank | Female Disability |
| Immigrants from Armenia | 1.0 /100 | #259 | Tragic 12.7% |
| Sub-Saharan Africans | 1.0 /100 | #260 | Tragic 12.7% |
| Bermudans | 1.0 /100 | #261 | Tragic 12.7% |
| Czechoslovakians | 0.9 /100 | #262 | Tragic 12.7% |
| Spaniards | 0.7 /100 | #263 | Tragic 12.8% |
| Alaska Natives | 0.6 /100 | #264 | Tragic 12.8% |
| West Indians | 0.5 /100 | #265 | Tragic 12.8% |
| Finns | 0.4 /100 | #266 | Tragic 12.8% |
| Senegalese | 0.4 /100 | #267 | Tragic 12.8% |
| Immigrants from Laos | 0.4 /100 | #268 | Tragic 12.8% |
| Indonesians | 0.4 /100 | #269 | Tragic 12.8% |
| Immigrants from Liberia | 0.3 /100 | #270 | Tragic 12.9% |
| Dutch | 0.2 /100 | #271 | Tragic 12.9% |
| Germans | 0.1 /100 | #272 | Tragic 12.9% |
| Sioux | 0.1 /100 | #273 | Tragic 12.9% |
Finnish Female Disability Correlation Summary
| Measurement | Finnish Data | Female Disability Data |
| Minimum | 0.14% | 1.2% |
| Maximum | 67.1% | 42.9% |
| Range | 67.0% | 41.7% |
| Mean | 24.4% | 15.5% |
| Median | 22.5% | 15.0% |
| Interquartile 25% (IQ1) | 11.4% | 12.6% |
| Interquartile 75% (IQ3) | 35.5% | 17.5% |
| Interquartile Range (IQR) | 24.2% | 5.0% |
| Standard Deviation (Sample) | 16.1% | 5.6% |
| Standard Deviation (Population) | 16.0% | 5.6% |
Correlation Details
| Finnish Percentile | Sample Size | Female Disability |
[ 0.0% - 0.5% ] 0.14% | 357,726,424 | 12.4% |
[ 0.5% - 1.0% ] 0.68% | 31,805,158 | 12.6% |
[ 1.0% - 1.5% ] 1.20% | 8,205,369 | 11.9% |
[ 1.5% - 2.0% ] 1.70% | 2,762,679 | 12.9% |
[ 2.0% - 2.5% ] 2.24% | 1,191,054 | 13.6% |
[ 2.5% - 3.0% ] 2.75% | 621,444 | 15.0% |
[ 3.0% - 3.5% ] 3.25% | 486,753 | 14.1% |
[ 3.5% - 4.0% ] 3.79% | 181,228 | 15.2% |
[ 4.0% - 4.5% ] 4.25% | 258,884 | 12.4% |
[ 4.5% - 5.0% ] 4.79% | 98,856 | 16.0% |
[ 5.0% - 5.5% ] 5.30% | 87,504 | 12.8% |
[ 5.5% - 6.0% ] 5.79% | 145,634 | 13.3% |
[ 6.0% - 6.5% ] 6.28% | 177,376 | 13.7% |
[ 6.5% - 7.0% ] 6.81% | 78,369 | 12.0% |
[ 7.0% - 7.5% ] 7.29% | 74,775 | 13.7% |
[ 7.5% - 8.0% ] 7.74% | 35,482 | 15.1% |
[ 8.0% - 8.5% ] 8.25% | 38,664 | 13.1% |
[ 8.5% - 9.0% ] 8.69% | 55,528 | 13.5% |
[ 9.0% - 9.5% ] 9.21% | 38,656 | 12.3% |
[ 9.5% - 10.0% ] 9.62% | 30,043 | 15.0% |
[ 10.0% - 10.5% ] 10.30% | 34,125 | 13.8% |
[ 10.5% - 11.0% ] 10.87% | 70,961 | 13.7% |
[ 11.0% - 11.5% ] 11.36% | 36,696 | 15.0% |
[ 11.5% - 12.0% ] 11.92% | 48,712 | 14.5% |
[ 12.0% - 12.5% ] 12.17% | 27,004 | 14.8% |
[ 12.5% - 13.0% ] 12.66% | 18,363 | 14.3% |
[ 13.0% - 13.5% ] 13.18% | 10,733 | 16.2% |
[ 13.5% - 14.0% ] 13.68% | 9,171 | 13.3% |
[ 14.0% - 14.5% ] 14.26% | 14,759 | 12.9% |
[ 14.5% - 15.0% ] 14.62% | 12,836 | 10.6% |
[ 15.0% - 15.5% ] 15.18% | 5,750 | 14.4% |
[ 15.5% - 16.0% ] 15.68% | 2,717 | 28.7% |
[ 16.0% - 16.5% ] 16.29% | 4,009 | 18.4% |
[ 16.5% - 17.0% ] 16.88% | 10,522 | 12.1% |
[ 17.0% - 17.5% ] 17.33% | 13,116 | 16.6% |
[ 17.5% - 18.0% ] 17.73% | 11,318 | 15.3% |
[ 18.0% - 18.5% ] 18.09% | 8,089 | 11.8% |
[ 18.5% - 19.0% ] 18.67% | 4,563 | 21.6% |
[ 19.0% - 19.5% ] 19.20% | 14,578 | 20.0% |
[ 19.5% - 20.0% ] 19.75% | 8,465 | 15.9% |
[ 20.0% - 20.5% ] 20.29% | 12,833 | 17.5% |
[ 20.5% - 21.0% ] 20.81% | 9,708 | 16.7% |
[ 21.0% - 21.5% ] 21.28% | 7,553 | 17.0% |
[ 21.5% - 22.0% ] 21.65% | 194 | 24.0% |
[ 22.0% - 22.5% ] 22.27% | 7,984 | 18.6% |
[ 22.5% - 23.0% ] 22.80% | 3,461 | 13.9% |
[ 23.0% - 23.5% ] 23.13% | 2,309 | 16.6% |
[ 23.5% - 24.0% ] 23.80% | 11,225 | 13.8% |
[ 24.0% - 24.5% ] 24.29% | 2,697 | 10.9% |
[ 24.5% - 25.0% ] 24.70% | 19,575 | 16.6% |
[ 25.0% - 25.5% ] 25.25% | 5,121 | 17.9% |
[ 25.5% - 26.0% ] 25.70% | 2,673 | 16.7% |
[ 26.0% - 26.5% ] 26.16% | 2,401 | 9.5% |
[ 26.5% - 27.0% ] 26.64% | 9,805 | 11.1% |
[ 27.0% - 27.5% ] 27.26% | 2,781 | 19.4% |
[ 27.5% - 28.0% ] 27.66% | 3,012 | 18.5% |
[ 28.0% - 28.5% ] 28.23% | 889 | 17.0% |
[ 28.5% - 29.0% ] 28.76% | 3,477 | 12.2% |
[ 29.0% - 29.5% ] 29.06% | 2,780 | 8.3% |
[ 29.5% - 30.0% ] 29.83% | 10,754 | 16.1% |
[ 30.5% - 31.0% ] 30.58% | 896 | 18.4% |
[ 31.0% - 31.5% ] 31.33% | 664 | 13.0% |
[ 32.5% - 33.0% ] 32.76% | 7,945 | 11.7% |
[ 33.0% - 33.5% ] 33.11% | 1,063 | 8.6% |
[ 34.0% - 34.5% ] 34.27% | 356 | 16.9% |
[ 34.5% - 35.0% ] 34.55% | 301 | 17.1% |
[ 35.0% - 35.5% ] 35.39% | 1,003 | 15.1% |
[ 35.5% - 36.0% ] 35.51% | 780 | 16.4% |
[ 36.5% - 37.0% ] 36.90% | 393 | 22.1% |
[ 37.0% - 37.5% ] 37.40% | 1,179 | 17.5% |
[ 37.5% - 38.0% ] 37.61% | 117 | 22.6% |
[ 38.0% - 38.5% ] 38.28% | 1,382 | 17.2% |
[ 38.5% - 39.0% ] 38.51% | 509 | 14.2% |
[ 39.5% - 40.0% ] 39.59% | 1,109 | 19.8% |
[ 40.5% - 41.0% ] 40.86% | 257 | 8.9% |
[ 41.0% - 41.5% ] 41.47% | 516 | 2.7% |
[ 42.0% - 42.5% ] 42.40% | 1,198 | 12.6% |
[ 43.0% - 43.5% ] 43.49% | 499 | 20.8% |
[ 43.5% - 44.0% ] 43.78% | 201 | 21.5% |
[ 44.0% - 44.5% ] 44.23% | 312 | 19.0% |
[ 44.5% - 45.0% ] 44.95% | 109 | 7.3% |
[ 46.5% - 47.0% ] 46.69% | 347 | 1.2% |
[ 49.5% - 50.0% ] 49.75% | 396 | 24.8% |
[ 51.5% - 52.0% ] 51.65% | 273 | 7.9% |
[ 52.5% - 53.0% ] 52.80% | 2,072 | 17.5% |
[ 56.5% - 57.0% ] 56.59% | 129 | 35.5% |
[ 57.0% - 57.5% ] 57.04% | 277 | 18.5% |
[ 58.5% - 59.0% ] 58.88% | 107 | 21.3% |
[ 60.0% - 60.5% ] 60.15% | 133 | 9.4% |
[ 67.0% - 67.5% ] 67.12% | 73 | 42.9% |