Delaware 2 or more Vehicles in Household
COMPARE
Delaware
Select to Compare
2 or more Vehicles in Household
Delaware 2 or more Vehicles in Household
58.2%
2+ VEHICLES AVAILABLE
99.4/ 100
METRIC RATING
79th/ 347
METRIC RANK
Delaware 2 or more Vehicles in Household Correlation Chart
The statistical analysis conducted on geographies consisting of 96,233,255 people shows a weak positive correlation between the proportion of Delaware and percentage of households with 2 or more vehicles available in the United States with a correlation coefficient (R) of 0.289 and weighted average of 58.2%. On average, for every 1% (one percent) increase in Delaware within a typical geography, there is an increase of 1.1% in percentage of households with 2 or more vehicles available.
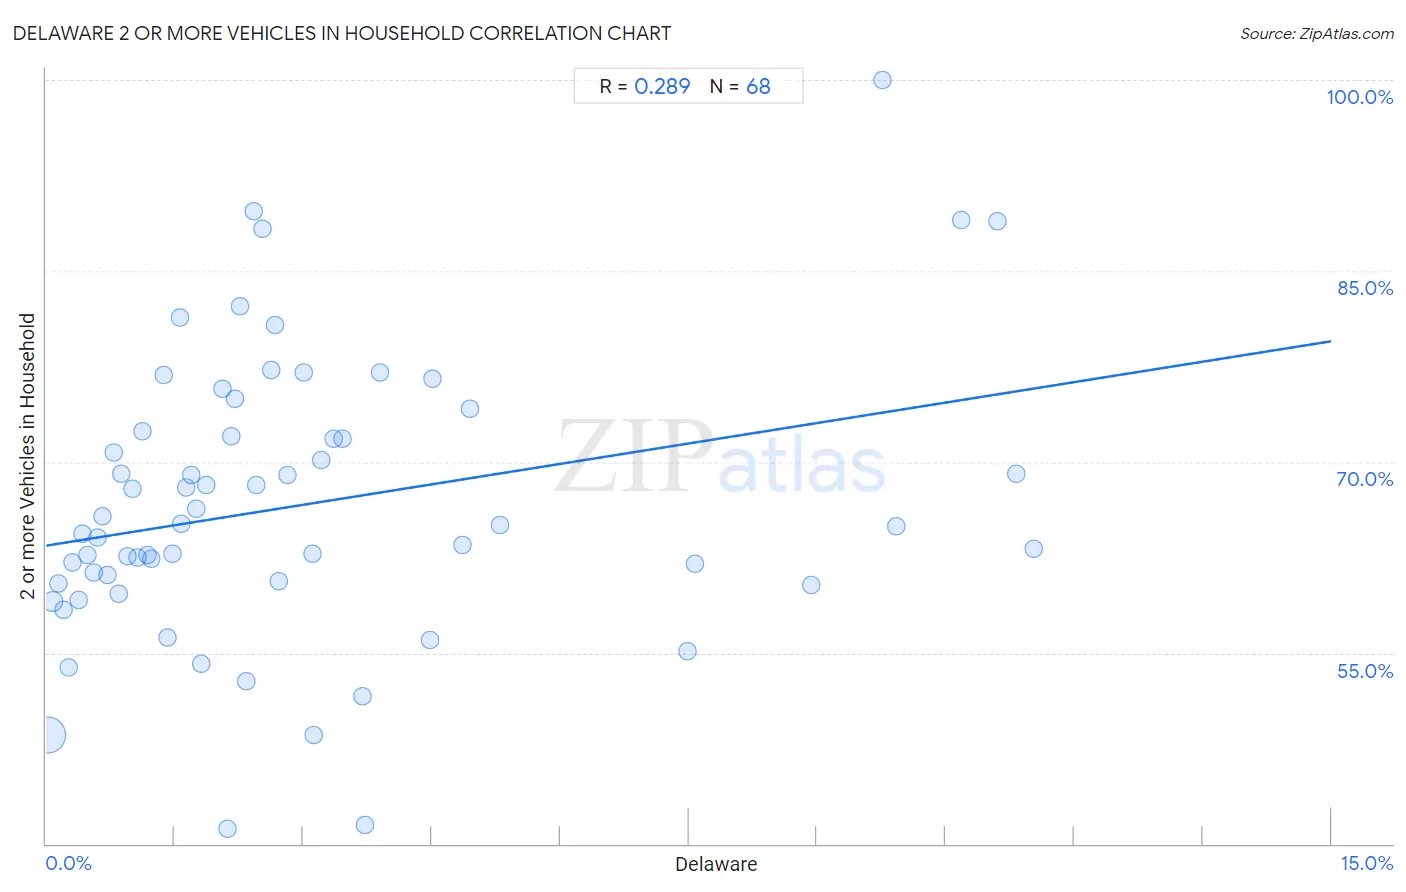
It is essential to understand that the correlation between the percentage of Delaware and percentage of households with 2 or more vehicles available does not imply a direct cause-and-effect relationship. It remains uncertain whether the presence of Delaware influences an upward or downward trend in the level of percentage of households with 2 or more vehicles available within an area, or if Delaware simply ended up residing in those areas with higher or lower levels of percentage of households with 2 or more vehicles available due to other factors.
Demographics Similar to Delaware by 2 or more Vehicles in Household
In terms of 2 or more vehicles in household, the demographic groups most similar to Delaware are Lithuanian (58.2%, a difference of 0.080%), Slovene (58.3%, a difference of 0.13%), Creek (58.3%, a difference of 0.14%), Immigrants from England (58.1%, a difference of 0.14%), and Immigrants from Iraq (58.1%, a difference of 0.16%).
| Demographics | Rating | Rank | 2 or more Vehicles in Household |
| Austrians | 99.6 /100 | #72 | Exceptional 58.4% |
| Bolivians | 99.6 /100 | #73 | Exceptional 58.3% |
| Immigrants from Afghanistan | 99.6 /100 | #74 | Exceptional 58.3% |
| Poles | 99.5 /100 | #75 | Exceptional 58.3% |
| Creek | 99.5 /100 | #76 | Exceptional 58.3% |
| Slovenes | 99.5 /100 | #77 | Exceptional 58.3% |
| Lithuanians | 99.5 /100 | #78 | Exceptional 58.2% |
| Delaware | 99.4 /100 | #79 | Exceptional 58.2% |
| Immigrants from England | 99.3 /100 | #80 | Exceptional 58.1% |
| Immigrants from Iraq | 99.3 /100 | #81 | Exceptional 58.1% |
| Iranians | 99.3 /100 | #82 | Exceptional 58.1% |
| Icelanders | 99.2 /100 | #83 | Exceptional 58.0% |
| Maltese | 99.2 /100 | #84 | Exceptional 58.0% |
| Slovaks | 99.2 /100 | #85 | Exceptional 58.0% |
| Potawatomi | 99.1 /100 | #86 | Exceptional 58.0% |
Delaware 2 or more Vehicles in Household Correlation Summary
| Measurement | Delaware Data | 2 or more Vehicles in Household Data |
| Minimum | 0.012% | 41.2% |
| Maximum | 11.5% | 100.0% |
| Range | 11.5% | 58.8% |
| Mean | 3.0% | 66.6% |
| Median | 2.1% | 65.0% |
| Interquartile 25% (IQ1) | 0.98% | 60.5% |
| Interquartile 75% (IQ3) | 3.6% | 72.2% |
| Interquartile Range (IQR) | 2.6% | 11.7% |
| Standard Deviation (Sample) | 3.0% | 11.1% |
| Standard Deviation (Population) | 3.0% | 11.1% |
Correlation Details
| Delaware Percentile | Sample Size | 2 or more Vehicles in Household |
[ 0.0% - 0.5% ] 0.012% | 80,511,824 | 48.6% |
[ 0.0% - 0.5% ] 0.079% | 8,453,733 | 59.0% |
[ 0.0% - 0.5% ] 0.14% | 2,684,182 | 60.4% |
[ 0.0% - 0.5% ] 0.20% | 1,580,628 | 58.4% |
[ 0.0% - 0.5% ] 0.26% | 720,666 | 53.9% |
[ 0.0% - 0.5% ] 0.31% | 479,358 | 62.1% |
[ 0.0% - 0.5% ] 0.37% | 411,610 | 59.1% |
[ 0.0% - 0.5% ] 0.43% | 293,341 | 64.4% |
[ 0.0% - 0.5% ] 0.49% | 189,758 | 62.7% |
[ 0.5% - 1.0% ] 0.55% | 191,886 | 61.3% |
[ 0.5% - 1.0% ] 0.60% | 155,173 | 64.1% |
[ 0.5% - 1.0% ] 0.66% | 68,530 | 65.7% |
[ 0.5% - 1.0% ] 0.72% | 94,870 | 61.1% |
[ 0.5% - 1.0% ] 0.79% | 60,100 | 70.7% |
[ 0.5% - 1.0% ] 0.84% | 15,716 | 59.6% |
[ 0.5% - 1.0% ] 0.88% | 19,518 | 69.1% |
[ 0.5% - 1.0% ] 0.94% | 21,424 | 62.6% |
[ 1.0% - 1.5% ] 1.01% | 16,457 | 67.9% |
[ 1.0% - 1.5% ] 1.06% | 49,209 | 62.5% |
[ 1.0% - 1.5% ] 1.13% | 11,869 | 72.4% |
[ 1.0% - 1.5% ] 1.18% | 39,987 | 62.6% |
[ 1.0% - 1.5% ] 1.23% | 23,772 | 62.3% |
[ 1.0% - 1.5% ] 1.38% | 5,818 | 76.8% |
[ 1.0% - 1.5% ] 1.42% | 3,379 | 56.2% |
[ 1.0% - 1.5% ] 1.48% | 8,780 | 62.8% |
[ 1.5% - 2.0% ] 1.56% | 1,541 | 81.4% |
[ 1.5% - 2.0% ] 1.57% | 1,525 | 65.1% |
[ 1.5% - 2.0% ] 1.64% | 35,349 | 68.0% |
[ 1.5% - 2.0% ] 1.70% | 2,239 | 69.0% |
[ 1.5% - 2.0% ] 1.76% | 6,031 | 66.3% |
[ 1.5% - 2.0% ] 1.80% | 388 | 54.1% |
[ 1.5% - 2.0% ] 1.87% | 9,024 | 68.2% |
[ 2.0% - 2.5% ] 2.06% | 2,135 | 75.7% |
[ 2.0% - 2.5% ] 2.12% | 2,450 | 41.2% |
[ 2.0% - 2.5% ] 2.16% | 2,917 | 72.0% |
[ 2.0% - 2.5% ] 2.20% | 12,277 | 75.0% |
[ 2.0% - 2.5% ] 2.26% | 1,373 | 82.3% |
[ 2.0% - 2.5% ] 2.34% | 3,034 | 52.7% |
[ 2.0% - 2.5% ] 2.42% | 207 | 89.7% |
[ 2.0% - 2.5% ] 2.45% | 4,238 | 68.2% |
[ 2.5% - 3.0% ] 2.53% | 3,914 | 88.3% |
[ 2.5% - 3.0% ] 2.63% | 1,216 | 77.2% |
[ 2.5% - 3.0% ] 2.67% | 375 | 80.7% |
[ 2.5% - 3.0% ] 2.72% | 1,177 | 60.7% |
[ 2.5% - 3.0% ] 2.82% | 3,194 | 68.9% |
[ 3.0% - 3.5% ] 3.00% | 1,499 | 77.0% |
[ 3.0% - 3.5% ] 3.11% | 2,315 | 62.8% |
[ 3.0% - 3.5% ] 3.12% | 2,528 | 48.5% |
[ 3.0% - 3.5% ] 3.21% | 436 | 70.2% |
[ 3.0% - 3.5% ] 3.36% | 2,114 | 71.8% |
[ 3.0% - 3.5% ] 3.46% | 4,475 | 71.8% |
[ 3.5% - 4.0% ] 3.69% | 1,057 | 51.6% |
[ 3.5% - 4.0% ] 3.72% | 1,938 | 41.4% |
[ 3.5% - 4.0% ] 3.89% | 822 | 77.0% |
[ 4.0% - 4.5% ] 4.48% | 581 | 56.0% |
[ 4.5% - 5.0% ] 4.51% | 532 | 76.5% |
[ 4.5% - 5.0% ] 4.86% | 2,303 | 63.5% |
[ 4.5% - 5.0% ] 4.94% | 587 | 74.2% |
[ 5.0% - 5.5% ] 5.30% | 132 | 65.0% |
[ 7.0% - 7.5% ] 7.49% | 2,002 | 55.1% |
[ 7.5% - 8.0% ] 7.58% | 132 | 62.0% |
[ 8.5% - 9.0% ] 8.93% | 929 | 60.3% |
[ 9.5% - 10.0% ] 9.76% | 41 | 100.0% |
[ 9.5% - 10.0% ] 9.92% | 524 | 64.9% |
[ 10.5% - 11.0% ] 10.68% | 702 | 89.0% |
[ 11.0% - 11.5% ] 11.11% | 18 | 88.9% |
[ 11.0% - 11.5% ] 11.32% | 468 | 69.1% |
[ 11.5% - 12.0% ] 11.53% | 928 | 63.2% |