Delaware College, Under 1 year
COMPARE
Delaware
Select to Compare
College, Under 1 year
Delaware College, Under 1 year
62.1%
COLLEGE, UNDER 1 YEAR
0.9/ 100
METRIC RATING
245th/ 347
METRIC RANK
Delaware College, Under 1 year Correlation Chart
The statistical analysis conducted on geographies consisting of 96,235,398 people shows a mild negative correlation between the proportion of Delaware and percentage of population with at least college, under 1 year education in the United States with a correlation coefficient (R) of -0.329 and weighted average of 62.1%. On average, for every 1% (one percent) increase in Delaware within a typical geography, there is a decrease of 1.4% in percentage of population with at least college, under 1 year education.
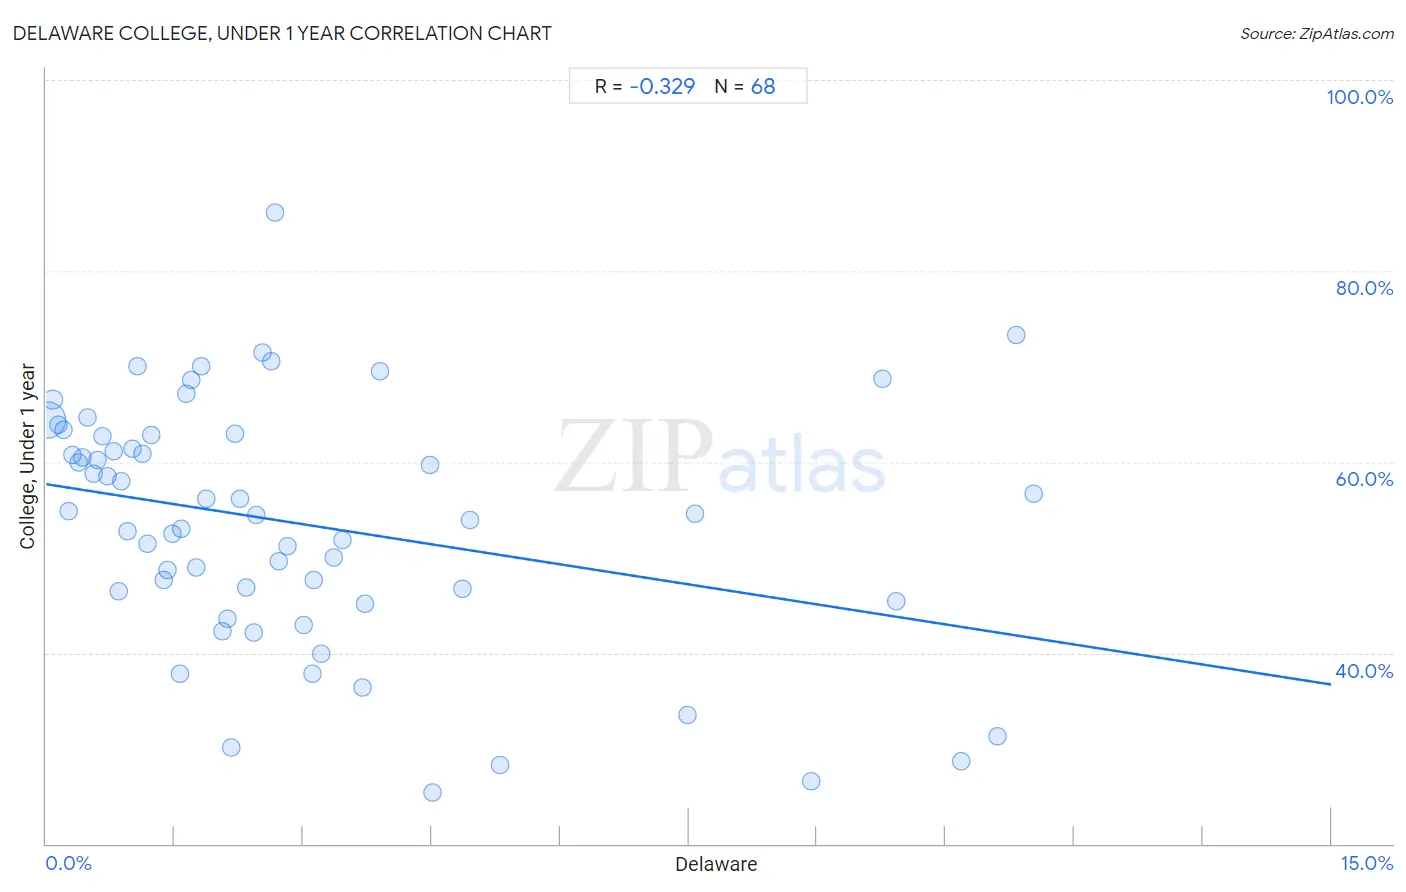
It is essential to understand that the correlation between the percentage of Delaware and percentage of population with at least college, under 1 year education does not imply a direct cause-and-effect relationship. It remains uncertain whether the presence of Delaware influences an upward or downward trend in the level of percentage of population with at least college, under 1 year education within an area, or if Delaware simply ended up residing in those areas with higher or lower levels of percentage of population with at least college, under 1 year education due to other factors.
Demographics Similar to Delaware by College, Under 1 year
In terms of college, under 1 year, the demographic groups most similar to Delaware are Colville (62.1%, a difference of 0.060%), Hawaiian (62.1%, a difference of 0.15%), Malaysian (62.2%, a difference of 0.18%), Marshallese (61.9%, a difference of 0.22%), and Ottawa (62.2%, a difference of 0.23%).
| Demographics | Rating | Rank | College, Under 1 year |
| French American Indians | 1.5 /100 | #238 | Tragic 62.4% |
| Nepalese | 1.1 /100 | #239 | Tragic 62.2% |
| Aleuts | 1.1 /100 | #240 | Tragic 62.2% |
| Ottawa | 1.1 /100 | #241 | Tragic 62.2% |
| Malaysians | 1.1 /100 | #242 | Tragic 62.2% |
| Hawaiians | 1.1 /100 | #243 | Tragic 62.1% |
| Colville | 1.0 /100 | #244 | Tragic 62.1% |
| Delaware | 0.9 /100 | #245 | Tragic 62.1% |
| Marshallese | 0.8 /100 | #246 | Tragic 61.9% |
| Immigrants from Liberia | 0.8 /100 | #247 | Tragic 61.9% |
| Potawatomi | 0.6 /100 | #248 | Tragic 61.8% |
| Vietnamese | 0.5 /100 | #249 | Tragic 61.7% |
| Immigrants from Congo | 0.5 /100 | #250 | Tragic 61.7% |
| Immigrants from Micronesia | 0.5 /100 | #251 | Tragic 61.5% |
| West Indians | 0.4 /100 | #252 | Tragic 61.5% |
Delaware College, Under 1 year Correlation Summary
| Measurement | Delaware Data | College, Under 1 year Data |
| Minimum | 0.012% | 25.3% |
| Maximum | 11.5% | 86.2% |
| Range | 11.5% | 60.9% |
| Mean | 3.0% | 53.5% |
| Median | 2.1% | 54.5% |
| Interquartile 25% (IQ1) | 0.98% | 45.9% |
| Interquartile 75% (IQ3) | 3.6% | 62.7% |
| Interquartile Range (IQR) | 2.6% | 16.8% |
| Standard Deviation (Sample) | 3.0% | 12.8% |
| Standard Deviation (Population) | 3.0% | 12.7% |
Correlation Details
| Delaware Percentile | Sample Size | College, Under 1 year |
[ 0.0% - 0.5% ] 0.012% | 80,511,824 | 64.4% |
[ 0.0% - 0.5% ] 0.079% | 8,453,733 | 66.5% |
[ 0.0% - 0.5% ] 0.14% | 2,684,182 | 63.9% |
[ 0.0% - 0.5% ] 0.20% | 1,575,027 | 63.4% |
[ 0.0% - 0.5% ] 0.26% | 720,666 | 54.9% |
[ 0.0% - 0.5% ] 0.31% | 481,866 | 60.8% |
[ 0.0% - 0.5% ] 0.37% | 413,045 | 60.0% |
[ 0.0% - 0.5% ] 0.43% | 293,341 | 60.5% |
[ 0.0% - 0.5% ] 0.49% | 189,758 | 64.7% |
[ 0.5% - 1.0% ] 0.55% | 191,886 | 58.7% |
[ 0.5% - 1.0% ] 0.60% | 155,173 | 60.2% |
[ 0.5% - 1.0% ] 0.66% | 68,530 | 62.7% |
[ 0.5% - 1.0% ] 0.72% | 94,870 | 58.5% |
[ 0.5% - 1.0% ] 0.79% | 63,901 | 61.1% |
[ 0.5% - 1.0% ] 0.84% | 15,716 | 46.4% |
[ 0.5% - 1.0% ] 0.88% | 19,518 | 58.0% |
[ 0.5% - 1.0% ] 0.94% | 21,424 | 52.8% |
[ 1.0% - 1.5% ] 1.01% | 16,457 | 61.3% |
[ 1.0% - 1.5% ] 1.06% | 49,209 | 70.0% |
[ 1.0% - 1.5% ] 1.13% | 11,869 | 60.8% |
[ 1.0% - 1.5% ] 1.18% | 39,987 | 51.4% |
[ 1.0% - 1.5% ] 1.23% | 23,772 | 62.8% |
[ 1.0% - 1.5% ] 1.38% | 5,818 | 47.6% |
[ 1.0% - 1.5% ] 1.42% | 3,379 | 48.7% |
[ 1.0% - 1.5% ] 1.48% | 8,780 | 52.4% |
[ 1.5% - 2.0% ] 1.56% | 1,541 | 37.8% |
[ 1.5% - 2.0% ] 1.57% | 1,525 | 53.0% |
[ 1.5% - 2.0% ] 1.64% | 35,349 | 67.1% |
[ 1.5% - 2.0% ] 1.70% | 2,239 | 68.6% |
[ 1.5% - 2.0% ] 1.76% | 6,031 | 49.0% |
[ 1.5% - 2.0% ] 1.80% | 388 | 70.1% |
[ 1.5% - 2.0% ] 1.87% | 9,024 | 56.1% |
[ 2.0% - 2.5% ] 2.06% | 2,135 | 42.3% |
[ 2.0% - 2.5% ] 2.12% | 2,450 | 43.6% |
[ 2.0% - 2.5% ] 2.16% | 2,917 | 30.1% |
[ 2.0% - 2.5% ] 2.20% | 12,277 | 62.9% |
[ 2.0% - 2.5% ] 2.26% | 1,373 | 56.2% |
[ 2.0% - 2.5% ] 2.34% | 3,034 | 46.8% |
[ 2.0% - 2.5% ] 2.42% | 207 | 42.1% |
[ 2.0% - 2.5% ] 2.45% | 4,238 | 54.4% |
[ 2.5% - 3.0% ] 2.53% | 3,914 | 71.5% |
[ 2.5% - 3.0% ] 2.63% | 1,216 | 70.5% |
[ 2.5% - 3.0% ] 2.67% | 375 | 86.2% |
[ 2.5% - 3.0% ] 2.72% | 1,177 | 49.5% |
[ 2.5% - 3.0% ] 2.82% | 3,194 | 51.1% |
[ 3.0% - 3.5% ] 3.00% | 1,499 | 42.9% |
[ 3.0% - 3.5% ] 3.11% | 2,315 | 37.8% |
[ 3.0% - 3.5% ] 3.12% | 2,528 | 47.6% |
[ 3.0% - 3.5% ] 3.21% | 436 | 39.9% |
[ 3.0% - 3.5% ] 3.36% | 2,114 | 50.0% |
[ 3.0% - 3.5% ] 3.46% | 4,475 | 51.8% |
[ 3.5% - 4.0% ] 3.69% | 1,057 | 36.4% |
[ 3.5% - 4.0% ] 3.72% | 1,938 | 45.2% |
[ 3.5% - 4.0% ] 3.89% | 822 | 69.5% |
[ 4.0% - 4.5% ] 4.48% | 581 | 59.6% |
[ 4.5% - 5.0% ] 4.51% | 532 | 25.3% |
[ 4.5% - 5.0% ] 4.86% | 2,303 | 46.7% |
[ 4.5% - 5.0% ] 4.94% | 587 | 53.9% |
[ 5.0% - 5.5% ] 5.30% | 132 | 28.3% |
[ 7.0% - 7.5% ] 7.49% | 2,002 | 33.5% |
[ 7.5% - 8.0% ] 7.58% | 132 | 54.5% |
[ 8.5% - 9.0% ] 8.93% | 929 | 26.6% |
[ 9.5% - 10.0% ] 9.76% | 41 | 68.8% |
[ 9.5% - 10.0% ] 9.92% | 524 | 45.5% |
[ 10.5% - 11.0% ] 10.68% | 702 | 28.6% |
[ 11.0% - 11.5% ] 11.11% | 18 | 31.2% |
[ 11.0% - 11.5% ] 11.32% | 468 | 73.3% |
[ 11.5% - 12.0% ] 11.53% | 928 | 56.6% |