Croatian Married-Couple Family Poverty

COMPARE

Croatian
Race
Ancestry
AfghanAfricanAlaska NativeAlaskan AthabascanAlbanianAleutAlsatianAmericanApacheArabArapahoArgentineanArmenianAssyrian/Chaldean/SyriacAustralianAustrianBahamianBangladeshiBarbadianBasqueBelgianBelizeanBermudanBhutaneseBlackfeetBolivianBrazilianBritishBritish West IndianBulgarianBurmeseCajunCambodianCanadianCape VerdeanCarpatho RusynCelticCentral AmericanCentral American IndianCherokeeCheyenneChickasawChileanChineseChippewaChoctawColombianColvilleComancheCosta RicanCreeCreekCroatianCrowCubanCypriotCzechCzechoslovakianDanishDelawareDominicanDutchDutch West IndianEastern EuropeanEcuadorianEgyptianEnglishEstonianEthiopianEuropeanFijianFilipinoFinnishFrenchFrench American IndianFrench CanadianGermanGerman RussianGhanaianGreekGuamanian/ChamorroGuatemalanGuyaneseHaitianHmongHonduranHopiHoumaHungarianIcelanderIndian (Asian)IndonesianInupiatIranianIraqiIrishIroquoisIsraeliItalianJamaicanJapaneseJordanianKenyanKiowaKoreanLaotianLatvianLebaneseLiberianLithuanianLumbeeLuxembourgerMacedonianMalaysianMalteseMarshalleseMenomineeMexicanMexican American IndianMongolianMoroccanNative HawaiianNavajoNepaleseNew ZealanderNicaraguanNigerianNorthern EuropeanNorwegianOkinawanOsageOttawaPaiutePakistaniPalestinianPanamanianParaguayanPennsylvania GermanPeruvianPimaPolishPortuguesePotawatomiPuebloPuerto RicanPuget Sound SalishRomanianRussianSalvadoranSamoanScandinavianScotch-IrishScottishSeminoleSenegaleseSerbianShoshoneSierra LeoneanSiouxSlavicSlovakSloveneSomaliSouth AfricanSouth AmericanSouth American IndianSoviet UnionSpaniardSpanishSpanish AmericanSpanish American IndianSri LankanSubsaharan AfricanSudaneseSwedishSwissSyrianTaiwaneseThaiTlingit-HaidaTohono O'OdhamTonganTrinidadian and TobagonianTsimshianTurkishU.S. Virgin IslanderUgandanUkrainianUruguayanUteVenezuelanVietnameseWelshWest IndianYakamaYaquiYugoslavianYumanYup'ikZimbabwean
Immigration
NonimmigrantsImmigrantsAfghanistanAfricaAlbaniaArgentinaArmeniaAsiaAustraliaAustriaBahamasBangladeshBarbadosBelarusBelgiumBelizeBoliviaBosnia and HerzegovinaBrazilBulgariaBurma/MyanmarCabo VerdeCambodiaCameroonCanadaCaribbeanCentral AmericaChileChinaColombiaCongoCosta RicaCroatiaCubaCzechoslovakiaDenmarkDominicaDominican RepublicEastern AfricaEastern AsiaEastern EuropeEcuadorEgyptEl SalvadorEnglandEritreaEthiopiaEuropeFijiFranceGermanyGhanaGreeceGrenadaGuatemalaGuyanaHaitiHondurasHong KongHungaryIndiaIndonesiaIranIraqIrelandIsraelItalyJamaicaJapanJordanKazakhstanKenyaKoreaKuwaitLaosLatin AmericaLatviaLebanonLiberiaLithuaniaMalaysiaMexicoMicronesiaMiddle AfricaMoldovaMoroccoNepalNetherlandsNicaraguaNigeriaNorth AmericaNorth MacedoniaNorthern AfricaNorthern EuropeNorwayOceaniaPakistanPanamaPeruPhilippinesPolandPortugalRomaniaRussiaSaudi ArabiaScotlandSenegalSerbiaSierra LeoneSingaporeSomaliaSouth AfricaSouth AmericaSouth Central AsiaSouth Eastern AsiaSouthern EuropeSpainSri LankaSt. Vincent and the GrenadinesSudanSwedenSwitzerlandSyriaTaiwanThailandTrinidad and TobagoTurkeyUgandaUkraineUruguayUzbekistanVenezuelaVietnamWest IndiesWestern AfricaWestern AsiaWestern EuropeYemenZaireZimbabweAzores
Select to Compare
Race
Ancestry
AfghanAfricanAlaska NativeAlaskan AthabascanAlbanianAleutAlsatianAmericanApacheArabArapahoArgentineanArmenianAssyrian/Chaldean/SyriacAustralianAustrianBahamianBangladeshiBarbadianBasqueBelgianBelizeanBermudanBhutaneseBlackfeetBolivianBrazilianBritishBritish West IndianBulgarianBurmeseCajunCambodianCanadianCape VerdeanCarpatho RusynCelticCentral AmericanCentral American IndianCherokeeCheyenneChickasawChileanChineseChippewaChoctawColombianColvilleComancheCosta RicanCreeCreekCrowCubanCypriotCzechCzechoslovakianDanishDelawareDominicanDutchDutch West IndianEastern EuropeanEcuadorianEgyptianEnglishEstonianEthiopianEuropeanFijianFilipinoFinnishFrenchFrench American IndianFrench CanadianGermanGerman RussianGhanaianGreekGuamanian/ChamorroGuatemalanGuyaneseHaitianHmongHonduranHopiHoumaHungarianIcelanderIndian (Asian)IndonesianInupiatIranianIraqiIrishIroquoisIsraeliItalianJamaicanJapaneseJordanianKenyanKiowaKoreanLaotianLatvianLebaneseLiberianLithuanianLumbeeLuxembourgerMacedonianMalaysianMalteseMarshalleseMenomineeMexicanMexican American IndianMongolianMoroccanNative HawaiianNavajoNepaleseNew ZealanderNicaraguanNigerianNorthern EuropeanNorwegianOkinawanOsageOttawaPaiutePakistaniPalestinianPanamanianParaguayanPennsylvania GermanPeruvianPimaPolishPortuguesePotawatomiPuebloPuerto RicanPuget Sound SalishRomanianRussianSalvadoranSamoanScandinavianScotch-IrishScottishSeminoleSenegaleseSerbianShoshoneSierra LeoneanSiouxSlavicSlovakSloveneSomaliSouth AfricanSouth AmericanSouth American IndianSoviet UnionSpaniardSpanishSpanish AmericanSpanish American IndianSri LankanSubsaharan AfricanSudaneseSwedishSwissSyrianTaiwaneseThaiTlingit-HaidaTohono O'OdhamTonganTrinidadian and TobagonianTsimshianTurkishU.S. Virgin IslanderUgandanUkrainianUruguayanUteVenezuelanVietnameseWelshWest IndianYakamaYaquiYugoslavianYumanYup'ikZimbabwean
Immigration
NonimmigrantsImmigrantsAfghanistanAfricaAlbaniaArgentinaArmeniaAsiaAustraliaAustriaBahamasBangladeshBarbadosBelarusBelgiumBelizeBoliviaBosnia and HerzegovinaBrazilBulgariaBurma/MyanmarCabo VerdeCambodiaCameroonCanadaCaribbeanCentral AmericaChileChinaColombiaCongoCosta RicaCroatiaCubaCzechoslovakiaDenmarkDominicaDominican RepublicEastern AfricaEastern AsiaEastern EuropeEcuadorEgyptEl SalvadorEnglandEritreaEthiopiaEuropeFijiFranceGermanyGhanaGreeceGrenadaGuatemalaGuyanaHaitiHondurasHong KongHungaryIndiaIndonesiaIranIraqIrelandIsraelItalyJamaicaJapanJordanKazakhstanKenyaKoreaKuwaitLaosLatin AmericaLatviaLebanonLiberiaLithuaniaMalaysiaMexicoMicronesiaMiddle AfricaMoldovaMoroccoNepalNetherlandsNicaraguaNigeriaNorth AmericaNorth MacedoniaNorthern AfricaNorthern EuropeNorwayOceaniaPakistanPanamaPeruPhilippinesPolandPortugalRomaniaRussiaSaudi ArabiaScotlandSenegalSerbiaSierra LeoneSingaporeSomaliaSouth AfricaSouth AmericaSouth Central AsiaSouth Eastern AsiaSouthern EuropeSpainSri LankaSt. Vincent and the GrenadinesSudanSwedenSwitzerlandSyriaTaiwanThailandTrinidad and TobagoTurkeyUgandaUkraineUruguayUzbekistanVenezuelaVietnamWest IndiesWestern AfricaWestern AsiaWestern EuropeYemenZaireZimbabweAzores
Married-Couple Family Poverty
Income
Poverty
Unemployment
Labor Participation
Family Structure
Vehicle Availability
Education Level
Disability

Croatian Married-Couple Family Poverty
Exceptional

3.9%
POVERTY | MARRIED-COUPLE FAMILIES
100.0/ 100
METRIC RATING
9th/ 347
METRIC RANK

Croatian Married-Couple Family Poverty Correlation Chart

The statistical analysis conducted on geographies consisting of 371,918,028 people shows a moderate positive correlation between the proportion of Croatians and poverty level among married-couple families in the United States with a correlation coefficient (R) of 0.462 and weighted average of 3.9%. On average, for every 1% (one percent) increase in Croatians within a typical geography, there is an increase of 0.35% in poverty level among married-couple families.
Croatian Married-Couple Family Poverty
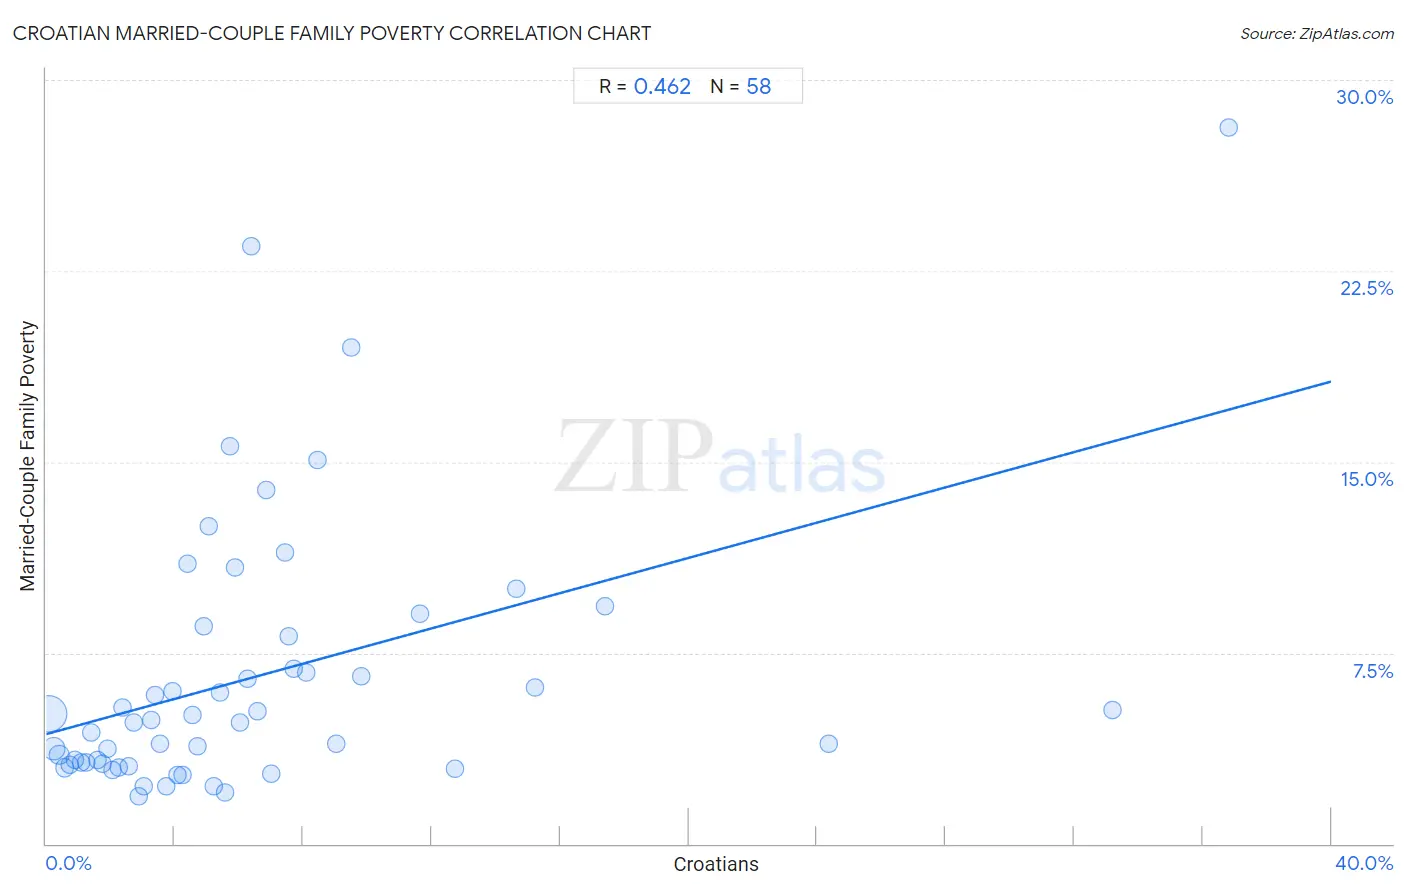
It is essential to understand that the correlation between the percentage of Croatians and poverty level among married-couple families does not imply a direct cause-and-effect relationship. It remains uncertain whether the presence of Croatians influences an upward or downward trend in the level of poverty level among married-couple families within an area, or if Croatians simply ended up residing in those areas with higher or lower levels of poverty level among married-couple families due to other factors.

Demographics Similar to Croatians by Married-Couple Family Poverty

In terms of married-couple family poverty, the demographic groups most similar to Croatians are Carpatho Rusyn (3.9%, a difference of 0.050%), Thai (3.9%, a difference of 0.44%), Lithuanian (4.0%, a difference of 0.56%), Latvian (3.9%, a difference of 0.98%), and Bulgarian (4.0%, a difference of 1.3%).
DemographicsRating | RankMarried-Couple Family Poverty
Chinese
100.0
/100
|
#2
Exceptional
3.6%
Norwegians
100.0
/100
|
#3
Exceptional
3.7%
Slovenes
100.0
/100
|
#4
Exceptional
3.8%
Swedes
100.0
/100
|
#5
Exceptional
3.9%
Luxembourgers
100.0
/100
|
#6
Exceptional
3.9%
Latvians
100.0
/100
|
#7
Exceptional
3.9%
Thais
100.0
/100
|
#8
Exceptional
3.9%
Croatians
100.0
/100
|
#9
Exceptional
3.9%
Carpatho Rusyns
100.0
/100
|
#10
Exceptional
3.9%
Lithuanians
100.0
/100
|
#11
Exceptional
4.0%
Bulgarians
100.0
/100
|
#12
Exceptional
4.0%
Czechs
100.0
/100
|
#13
Exceptional
4.0%
Slovaks
100.0
/100
|
#14
Exceptional
4.0%
Poles
100.0
/100
|
#15
Exceptional
4.0%
Germans
100.0
/100
|
#16
Exceptional
4.0%

Croatian Married-Couple Family Poverty Correlation Summary

MeasurementCroatian DataMarried-Couple Family Poverty Data
Minimum0.073%1.8%
Maximum36.8%28.1%
Range36.7%26.3%
Mean6.5%6.6%
Median4.8%4.8%
Interquartile 25% (IQ1)2.4%3.2%
Interquartile 75% (IQ3)7.6%8.1%
Interquartile Range (IQR)5.2%5.0%
Standard Deviation (Sample)7.1%5.3%
Standard Deviation (Population)7.0%5.3%

Correlation Details

Croatian PercentileSample SizeMarried-Couple Family Poverty
[
0.0%
-
0.5%
]
0.073%
255,315,0255.1%
[
0.0%
-
0.5%
]
0.23%
69,298,8963.7%
[
0.0%
-
0.5%
]
0.40%
22,293,1013.5%
[
0.5%
-
1.0%
]
0.57%
9,465,4803.0%
[
0.5%
-
1.0%
]
0.74%
5,658,9153.1%
[
0.5%
-
1.0%
]
0.91%
3,018,1433.3%
[
1.0%
-
1.5%
]
1.08%
1,730,9323.2%
[
1.0%
-
1.5%
]
1.24%
963,3823.2%
[
1.0%
-
1.5%
]
1.40%
610,8164.4%
[
1.5%
-
2.0%
]
1.58%
496,7733.3%
[
1.5%
-
2.0%
]
1.75%
610,8543.2%
[
1.5%
-
2.0%
]
1.91%
476,5473.7%
[
2.0%
-
2.5%
]
2.07%
332,8982.9%
[
2.0%
-
2.5%
]
2.24%
338,4133.0%
[
2.0%
-
2.5%
]
2.39%
311,5315.4%
[
2.5%
-
3.0%
]
2.58%
165,5493.0%
[
2.5%
-
3.0%
]
2.71%
107,8384.8%
[
2.5%
-
3.0%
]
2.89%
160,9631.8%
[
3.0%
-
3.5%
]
3.03%
117,7522.3%
[
3.0%
-
3.5%
]
3.25%
14,4634.9%
[
3.0%
-
3.5%
]
3.38%
49,2965.9%
[
3.5%
-
4.0%
]
3.55%
39,3863.9%
[
3.5%
-
4.0%
]
3.72%
73,1532.2%
[
3.5%
-
4.0%
]
3.92%
16,2306.0%
[
4.0%
-
4.5%
]
4.08%
27,8332.7%
[
4.0%
-
4.5%
]
4.23%
108,0282.7%
[
4.0%
-
4.5%
]
4.39%
6,12411.0%
[
4.5%
-
5.0%
]
4.54%
14,3925.0%
[
4.5%
-
5.0%
]
4.70%
7,9793.8%
[
4.5%
-
5.0%
]
4.92%
3,1948.5%
[
5.0%
-
5.5%
]
5.06%
2,13612.5%
[
5.0%
-
5.5%
]
5.20%
13,2742.3%
[
5.0%
-
5.5%
]
5.40%
1,1865.9%
[
5.5%
-
6.0%
]
5.58%
29,4152.0%
[
5.5%
-
6.0%
]
5.73%
2,39115.6%
[
5.5%
-
6.0%
]
5.87%
7,07010.8%
[
6.0%
-
6.5%
]
6.02%
5,0334.7%
[
6.0%
-
6.5%
]
6.25%
5286.5%
[
6.0%
-
6.5%
]
6.38%
1,91223.5%
[
6.5%
-
7.0%
]
6.57%
3355.2%
[
6.5%
-
7.0%
]
6.83%
1,62513.9%
[
7.0%
-
7.5%
]
7.00%
8,3982.8%
[
7.0%
-
7.5%
]
7.42%
1,55011.4%
[
7.5%
-
8.0%
]
7.57%
1,7318.1%
[
7.5%
-
8.0%
]
7.72%
2986.9%
[
8.0%
-
8.5%
]
8.10%
1,2846.7%
[
8.0%
-
8.5%
]
8.46%
26015.1%
[
9.0%
-
9.5%
]
9.03%
2993.9%
[
9.0%
-
9.5%
]
9.48%
30619.5%
[
9.5%
-
10.0%
]
9.82%
1,1816.6%
[
11.5%
-
12.0%
]
11.62%
9129.0%
[
12.5%
-
13.0%
]
12.71%
4802.9%
[
14.5%
-
15.0%
]
14.62%
25310.0%
[
15.0%
-
15.5%
]
15.23%
3486.2%
[
17.0%
-
17.5%
]
17.41%
1,2529.3%
[
24.0%
-
24.5%
]
24.36%
3123.9%
[
33.0%
-
33.5%
]
33.19%
2295.3%
[
36.5%
-
37.0%
]
36.81%
14428.1%