Seminole Disability
COMPARE
Seminole
Select to Compare
Disability
Seminole Disability
14.9%
DISABILITY
0.0/ 100
METRIC RATING
337th/ 347
METRIC RANK
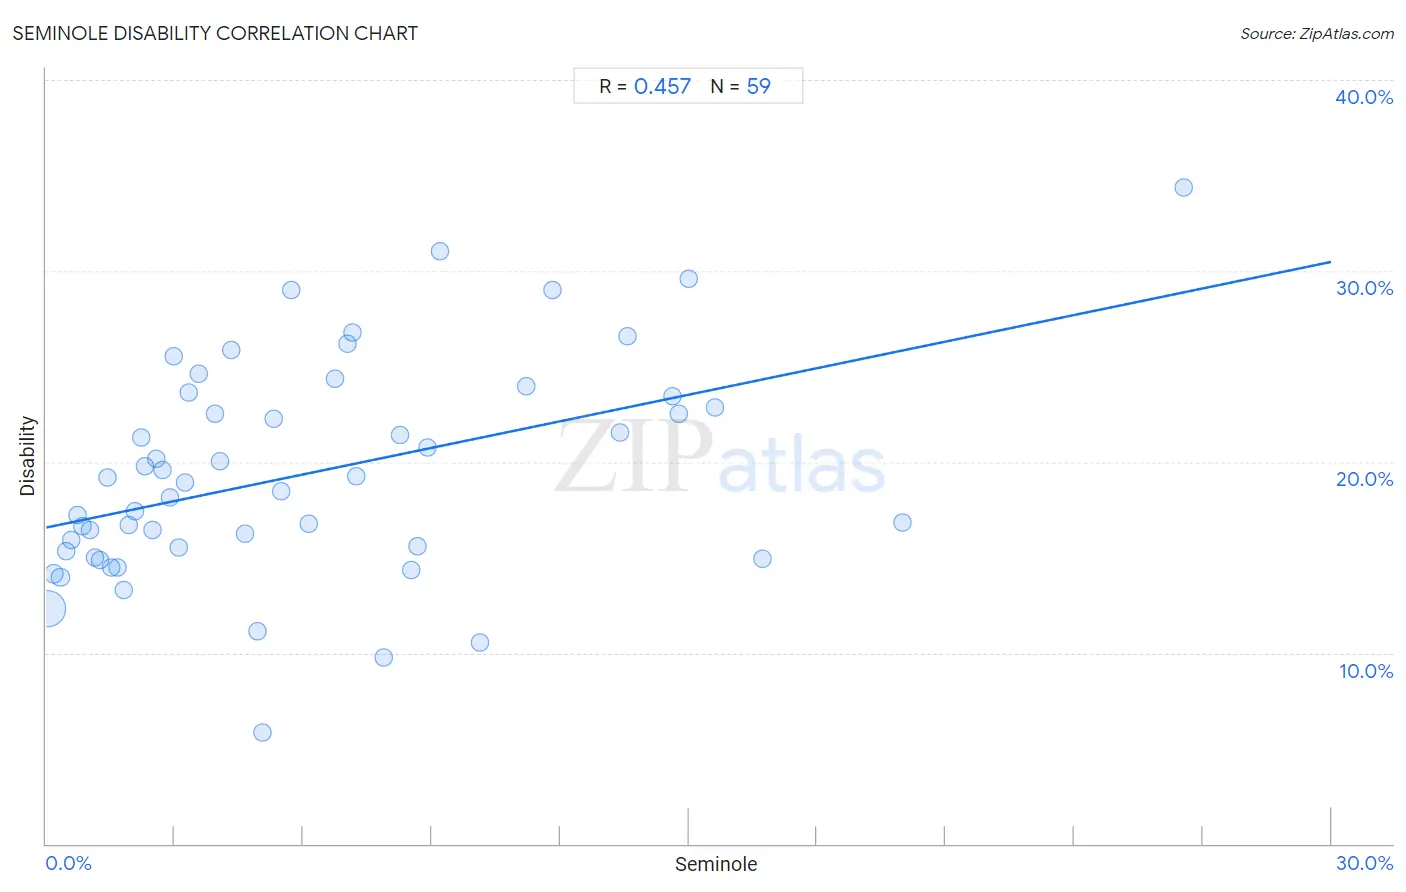
Seminole Disability Correlation Chart
The statistical analysis conducted on geographies consisting of 118,308,491 people shows a moderate positive correlation between the proportion of Seminole and percentage of population with a disability in the United States with a correlation coefficient (R) of 0.457 and weighted average of 14.9%. On average, for every 1% (one percent) increase in Seminole within a typical geography, there is an increase of 0.46% in percentage of population with a disability.
It is essential to understand that the correlation between the percentage of Seminole and percentage of population with a disability does not imply a direct cause-and-effect relationship. It remains uncertain whether the presence of Seminole influences an upward or downward trend in the level of percentage of population with a disability within an area, or if Seminole simply ended up residing in those areas with higher or lower levels of percentage of population with a disability due to other factors.
Demographics Similar to Seminole by Disability
In terms of disability, the demographic groups most similar to Seminole are Cherokee (14.8%, a difference of 0.090%), Dutch West Indian (14.9%, a difference of 0.30%), Tohono O'odham (14.8%, a difference of 0.61%), Yuman (14.6%, a difference of 1.7%), and Cajun (14.6%, a difference of 1.8%).
| Demographics | Rating | Rank | Disability |
| Navajo | 0.0 /100 | #330 | Tragic 14.3% |
| Alaskan Athabascans | 0.0 /100 | #331 | Tragic 14.4% |
| Pueblo | 0.0 /100 | #332 | Tragic 14.4% |
| Cajuns | 0.0 /100 | #333 | Tragic 14.6% |
| Yuman | 0.0 /100 | #334 | Tragic 14.6% |
| Tohono O'odham | 0.0 /100 | #335 | Tragic 14.8% |
| Cherokee | 0.0 /100 | #336 | Tragic 14.8% |
| Seminole | 0.0 /100 | #337 | Tragic 14.9% |
| Dutch West Indians | 0.0 /100 | #338 | Tragic 14.9% |
| Chickasaw | 0.0 /100 | #339 | Tragic 15.2% |
| Choctaw | 0.0 /100 | #340 | Tragic 15.4% |
| Lumbee | 0.0 /100 | #341 | Tragic 15.5% |
| Kiowa | 0.0 /100 | #342 | Tragic 15.6% |
| Creek | 0.0 /100 | #343 | Tragic 15.6% |
| Colville | 0.0 /100 | #344 | Tragic 15.8% |
Seminole Disability Correlation Summary
| Measurement | Seminole Data | Disability Data |
| Minimum | 0.021% | 5.8% |
| Maximum | 26.6% | 34.4% |
| Range | 26.5% | 28.5% |
| Mean | 6.1% | 19.4% |
| Median | 4.3% | 18.9% |
| Interquartile 25% (IQ1) | 1.9% | 15.3% |
| Interquartile 75% (IQ3) | 8.7% | 23.4% |
| Interquartile Range (IQR) | 6.7% | 8.1% |
| Standard Deviation (Sample) | 5.6% | 5.7% |
| Standard Deviation (Population) | 5.5% | 5.6% |
Correlation Details
| Seminole Percentile | Sample Size | Disability |
[ 0.0% - 0.5% ] 0.021% | 107,220,258 | 12.3% |
[ 0.0% - 0.5% ] 0.18% | 6,405,917 | 14.1% |
[ 0.0% - 0.5% ] 0.33% | 2,256,309 | 14.0% |
[ 0.0% - 0.5% ] 0.46% | 922,888 | 15.3% |
[ 0.5% - 1.0% ] 0.58% | 467,406 | 15.9% |
[ 0.5% - 1.0% ] 0.73% | 194,343 | 17.2% |
[ 0.5% - 1.0% ] 0.84% | 151,779 | 16.6% |
[ 1.0% - 1.5% ] 1.02% | 124,575 | 16.4% |
[ 1.0% - 1.5% ] 1.13% | 179,231 | 15.0% |
[ 1.0% - 1.5% ] 1.25% | 63,479 | 14.8% |
[ 1.0% - 1.5% ] 1.42% | 30,407 | 19.2% |
[ 1.5% - 2.0% ] 1.52% | 14,866 | 14.5% |
[ 1.5% - 2.0% ] 1.67% | 25,341 | 14.4% |
[ 1.5% - 2.0% ] 1.81% | 61,754 | 13.3% |
[ 1.5% - 2.0% ] 1.92% | 7,561 | 16.7% |
[ 2.0% - 2.5% ] 2.07% | 41,984 | 17.4% |
[ 2.0% - 2.5% ] 2.22% | 22,385 | 21.3% |
[ 2.0% - 2.5% ] 2.30% | 22,869 | 19.8% |
[ 2.0% - 2.5% ] 2.48% | 6,282 | 16.4% |
[ 2.5% - 3.0% ] 2.57% | 1,787 | 20.2% |
[ 2.5% - 3.0% ] 2.72% | 4,003 | 19.6% |
[ 2.5% - 3.0% ] 2.90% | 9,350 | 18.2% |
[ 2.5% - 3.0% ] 2.96% | 6,920 | 25.5% |
[ 3.0% - 3.5% ] 3.11% | 9,976 | 15.5% |
[ 3.0% - 3.5% ] 3.23% | 4,178 | 18.9% |
[ 3.0% - 3.5% ] 3.33% | 60 | 23.6% |
[ 3.5% - 4.0% ] 3.56% | 3,964 | 24.6% |
[ 3.5% - 4.0% ] 3.93% | 280 | 22.5% |
[ 4.0% - 4.5% ] 4.05% | 2,422 | 20.0% |
[ 4.0% - 4.5% ] 4.31% | 116 | 25.9% |
[ 4.5% - 5.0% ] 4.63% | 216 | 16.2% |
[ 4.5% - 5.0% ] 4.94% | 162 | 11.1% |
[ 5.0% - 5.5% ] 5.06% | 257 | 5.8% |
[ 5.0% - 5.5% ] 5.32% | 1,110 | 22.3% |
[ 5.0% - 5.5% ] 5.48% | 292 | 18.5% |
[ 5.5% - 6.0% ] 5.71% | 403 | 29.0% |
[ 6.0% - 6.5% ] 6.12% | 245 | 16.7% |
[ 6.5% - 7.0% ] 6.73% | 1,367 | 24.3% |
[ 7.0% - 7.5% ] 7.03% | 313 | 26.2% |
[ 7.0% - 7.5% ] 7.14% | 168 | 26.8% |
[ 7.0% - 7.5% ] 7.23% | 1,190 | 19.3% |
[ 7.5% - 8.0% ] 7.89% | 1,166 | 9.8% |
[ 8.0% - 8.5% ] 8.25% | 1,805 | 21.4% |
[ 8.5% - 9.0% ] 8.51% | 188 | 14.4% |
[ 8.5% - 9.0% ] 8.67% | 2,019 | 15.6% |
[ 8.5% - 9.0% ] 8.89% | 405 | 20.7% |
[ 9.0% - 9.5% ] 9.20% | 174 | 31.0% |
[ 10.0% - 10.5% ] 10.11% | 445 | 10.6% |
[ 11.0% - 11.5% ] 11.19% | 12,329 | 24.0% |
[ 11.5% - 12.0% ] 11.83% | 372 | 29.0% |
[ 13.0% - 13.5% ] 13.40% | 2,887 | 21.5% |
[ 13.5% - 14.0% ] 13.57% | 5,578 | 26.6% |
[ 14.5% - 15.0% ] 14.63% | 1,169 | 23.4% |
[ 14.5% - 15.0% ] 14.77% | 7,144 | 22.5% |
[ 15.0% - 15.5% ] 15.01% | 3,124 | 29.6% |
[ 15.5% - 16.0% ] 15.60% | 564 | 22.9% |
[ 16.5% - 17.0% ] 16.73% | 550 | 14.9% |
[ 20.0% - 20.5% ] 20.00% | 95 | 16.8% |
[ 26.5% - 27.0% ] 26.56% | 64 | 34.4% |