Irish Unemployment Among Women with Children Ages 6 to 17 years
COMPARE
Irish
Select to Compare
Unemployment Among Women with Children Ages 6 to 17 years
Irish Unemployment Among Women with Children Ages 6 to 17 years
9.5%
UNEMPLOYMENT | WOMEN W/ CHILDREN 6 TO 17
0.3/ 100
METRIC RATING
267th/ 347
METRIC RANK
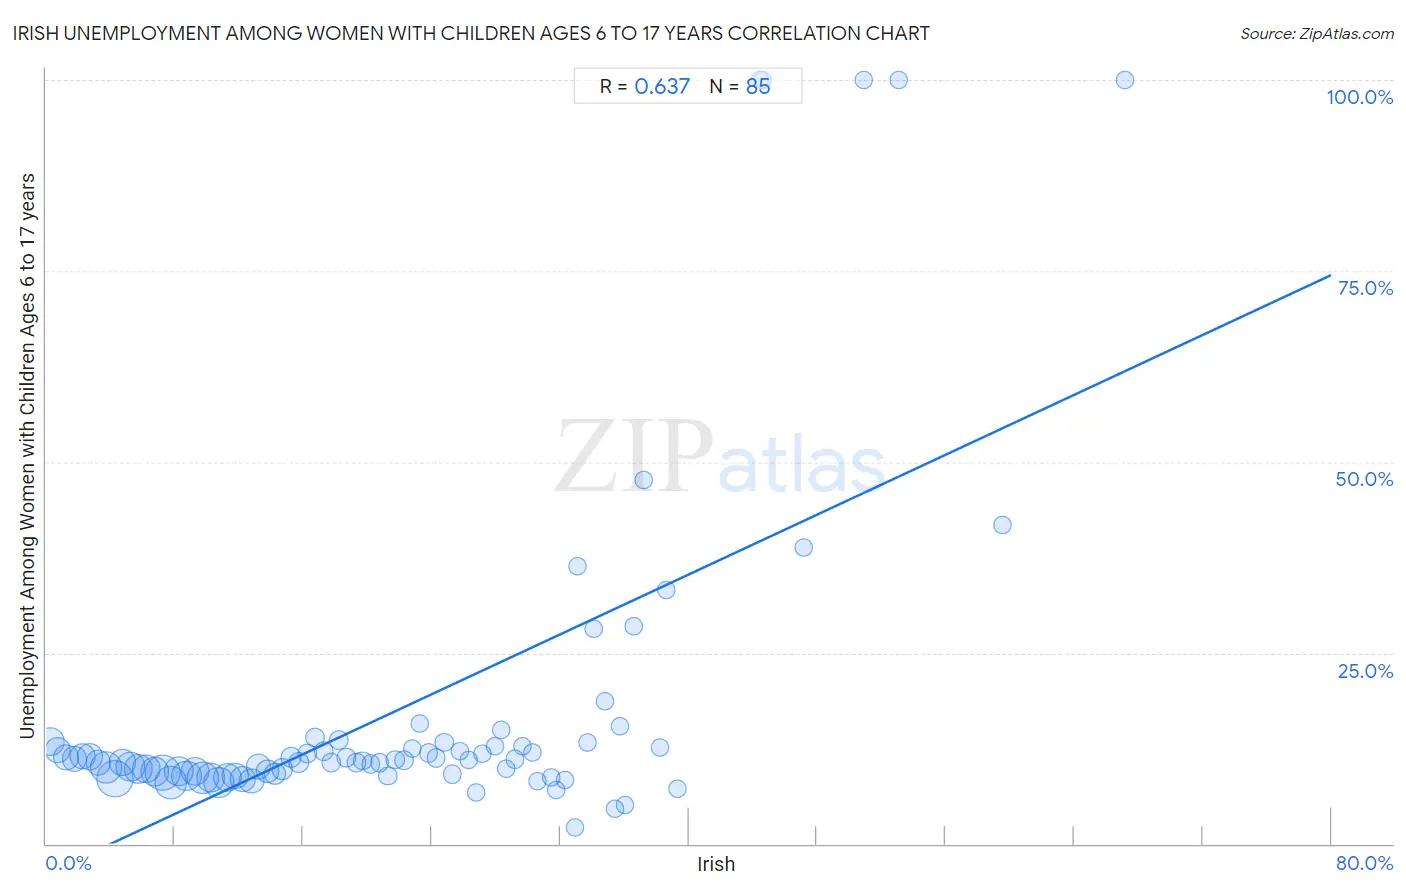
Irish Unemployment Among Women with Children Ages 6 to 17 years Correlation Chart
The statistical analysis conducted on geographies consisting of 359,522,437 people shows a significant positive correlation between the proportion of Irish and unemployment rate among women with children between the ages 6 and 17 in the United States with a correlation coefficient (R) of 0.637 and weighted average of 9.5%. On average, for every 1% (one percent) increase in Irish within a typical geography, there is an increase of 0.98% in unemployment rate among women with children between the ages 6 and 17.
It is essential to understand that the correlation between the percentage of Irish and unemployment rate among women with children between the ages 6 and 17 does not imply a direct cause-and-effect relationship. It remains uncertain whether the presence of Irish influences an upward or downward trend in the level of unemployment rate among women with children between the ages 6 and 17 within an area, or if Irish simply ended up residing in those areas with higher or lower levels of unemployment rate among women with children between the ages 6 and 17 due to other factors.
Demographics Similar to Irish by Unemployment Among Women with Children Ages 6 to 17 years
In terms of unemployment among women with children ages 6 to 17 years, the demographic groups most similar to Irish are Immigrants from Jamaica (9.5%, a difference of 0.020%), West Indian (9.5%, a difference of 0.18%), Immigrants from Ghana (9.5%, a difference of 0.21%), Ghanaian (9.6%, a difference of 0.39%), and Lebanese (9.5%, a difference of 0.45%).
| Demographics | Rating | Rank | Unemployment Among Women with Children Ages 6 to 17 years |
| Italians | 0.6 /100 | #260 | Tragic 9.5% |
| South Americans | 0.5 /100 | #261 | Tragic 9.5% |
| Senegalese | 0.5 /100 | #262 | Tragic 9.5% |
| Lebanese | 0.5 /100 | #263 | Tragic 9.5% |
| Immigrants from Ghana | 0.4 /100 | #264 | Tragic 9.5% |
| West Indians | 0.4 /100 | #265 | Tragic 9.5% |
| Immigrants from Jamaica | 0.3 /100 | #266 | Tragic 9.5% |
| Irish | 0.3 /100 | #267 | Tragic 9.5% |
| Ghanaians | 0.2 /100 | #268 | Tragic 9.6% |
| Blackfeet | 0.2 /100 | #269 | Tragic 9.6% |
| Immigrants from Nicaragua | 0.2 /100 | #270 | Tragic 9.6% |
| Immigrants from Latin America | 0.1 /100 | #271 | Tragic 9.6% |
| Kiowa | 0.1 /100 | #272 | Tragic 9.6% |
| Whites/Caucasians | 0.1 /100 | #273 | Tragic 9.6% |
| Aleuts | 0.1 /100 | #274 | Tragic 9.6% |
Irish Unemployment Among Women with Children Ages 6 to 17 years Correlation Summary
| Measurement | Irish Data | Unemployment Among Women with Children Ages 6 to 17 years Data |
| Minimum | 0.26% | 2.1% |
| Maximum | 67.2% | 100.0% |
| Range | 66.9% | 97.9% |
| Mean | 22.2% | 17.8% |
| Median | 21.3% | 10.9% |
| Interquartile 25% (IQ1) | 10.5% | 9.2% |
| Interquartile 75% (IQ3) | 32.0% | 13.0% |
| Interquartile Range (IQR) | 21.5% | 3.8% |
| Standard Deviation (Sample) | 14.4% | 22.1% |
| Standard Deviation (Population) | 14.3% | 21.9% |
Correlation Details
| Irish Percentile | Sample Size | Unemployment Among Women with Children Ages 6 to 17 years |
[ 0.0% - 0.5% ] 0.26% | 10,656,442 | 13.4% |
[ 0.5% - 1.0% ] 0.73% | 8,399,348 | 12.2% |
[ 1.0% - 1.5% ] 1.27% | 8,940,320 | 11.3% |
[ 1.5% - 2.0% ] 1.76% | 8,361,914 | 11.1% |
[ 2.0% - 2.5% ] 2.26% | 8,496,850 | 11.5% |
[ 2.5% - 3.0% ] 2.74% | 8,958,015 | 11.4% |
[ 3.0% - 3.5% ] 3.24% | 8,281,854 | 10.7% |
[ 3.5% - 4.0% ] 3.70% | 16,035,418 | 10.0% |
[ 4.0% - 4.5% ] 4.31% | 21,574,332 | 8.6% |
[ 4.5% - 5.0% ] 4.73% | 10,237,800 | 10.6% |
[ 5.0% - 5.5% ] 5.24% | 12,104,083 | 10.1% |
[ 5.5% - 6.0% ] 5.74% | 12,514,807 | 9.8% |
[ 6.0% - 6.5% ] 6.24% | 11,405,997 | 9.8% |
[ 6.5% - 7.0% ] 6.77% | 12,126,496 | 9.4% |
[ 7.0% - 7.5% ] 7.25% | 19,675,755 | 9.3% |
[ 7.5% - 8.0% ] 7.75% | 17,078,565 | 8.1% |
[ 8.0% - 8.5% ] 8.25% | 12,929,662 | 9.4% |
[ 8.5% - 9.0% ] 8.72% | 13,804,568 | 8.9% |
[ 9.0% - 9.5% ] 9.26% | 11,365,665 | 9.5% |
[ 9.5% - 10.0% ] 9.74% | 15,030,493 | 8.6% |
[ 10.0% - 10.5% ] 10.23% | 12,818,038 | 8.7% |
[ 10.5% - 11.0% ] 10.73% | 14,220,092 | 8.0% |
[ 11.0% - 11.5% ] 11.27% | 11,713,010 | 8.7% |
[ 11.5% - 12.0% ] 11.75% | 9,568,319 | 8.9% |
[ 12.0% - 12.5% ] 12.22% | 8,064,593 | 8.5% |
[ 12.5% - 13.0% ] 12.77% | 7,971,832 | 8.2% |
[ 13.0% - 13.5% ] 13.22% | 7,879,895 | 10.1% |
[ 13.5% - 14.0% ] 13.74% | 5,602,796 | 9.5% |
[ 14.0% - 14.5% ] 14.24% | 4,429,303 | 9.2% |
[ 14.5% - 15.0% ] 14.72% | 3,449,599 | 9.8% |
[ 15.0% - 15.5% ] 15.24% | 3,354,336 | 11.3% |
[ 15.5% - 16.0% ] 15.75% | 2,920,912 | 10.6% |
[ 16.0% - 16.5% ] 16.25% | 2,078,673 | 11.8% |
[ 16.5% - 17.0% ] 16.73% | 1,409,933 | 13.9% |
[ 17.0% - 17.5% ] 17.25% | 1,544,753 | 12.1% |
[ 17.5% - 18.0% ] 17.74% | 1,293,595 | 10.7% |
[ 18.0% - 18.5% ] 18.23% | 1,347,462 | 13.6% |
[ 18.5% - 19.0% ] 18.70% | 1,138,196 | 11.2% |
[ 19.0% - 19.5% ] 19.28% | 1,160,819 | 10.6% |
[ 19.5% - 20.0% ] 19.72% | 1,035,785 | 10.8% |
[ 20.0% - 20.5% ] 20.21% | 992,631 | 10.4% |
[ 20.5% - 21.0% ] 20.74% | 879,682 | 10.6% |
[ 21.0% - 21.5% ] 21.26% | 680,945 | 8.9% |
[ 21.5% - 22.0% ] 21.72% | 697,291 | 11.0% |
[ 22.0% - 22.5% ] 22.28% | 870,143 | 10.9% |
[ 22.5% - 23.0% ] 22.76% | 472,592 | 12.5% |
[ 23.0% - 23.5% ] 23.25% | 485,721 | 15.7% |
[ 23.5% - 24.0% ] 23.78% | 366,318 | 11.9% |
[ 24.0% - 24.5% ] 24.26% | 280,253 | 11.2% |
[ 24.5% - 25.0% ] 24.79% | 229,386 | 13.2% |
[ 25.0% - 25.5% ] 25.29% | 391,694 | 9.1% |
[ 25.5% - 26.0% ] 25.75% | 241,438 | 12.1% |
[ 26.0% - 26.5% ] 26.27% | 142,133 | 11.0% |
[ 26.5% - 27.0% ] 26.77% | 149,749 | 6.7% |
[ 27.0% - 27.5% ] 27.13% | 136,008 | 11.7% |
[ 27.5% - 28.0% ] 27.90% | 120,434 | 12.8% |
[ 28.0% - 28.5% ] 28.30% | 241,617 | 14.9% |
[ 28.5% - 29.0% ] 28.66% | 151,721 | 9.8% |
[ 29.0% - 29.5% ] 29.19% | 185,564 | 11.1% |
[ 29.5% - 30.0% ] 29.68% | 135,862 | 12.8% |
[ 30.0% - 30.5% ] 30.30% | 97,133 | 12.0% |
[ 30.5% - 31.0% ] 30.62% | 80,638 | 8.2% |
[ 31.0% - 31.5% ] 31.40% | 74,796 | 8.6% |
[ 31.5% - 32.0% ] 31.74% | 55,213 | 7.1% |
[ 32.0% - 32.5% ] 32.28% | 11,559 | 8.4% |
[ 32.5% - 33.0% ] 32.92% | 65,406 | 2.1% |
[ 33.0% - 33.5% ] 33.04% | 1,365 | 36.4% |
[ 33.5% - 34.0% ] 33.71% | 54,414 | 13.3% |
[ 34.0% - 34.5% ] 34.11% | 9,495 | 28.1% |
[ 34.5% - 35.0% ] 34.80% | 62,354 | 18.6% |
[ 35.0% - 35.5% ] 35.38% | 57,133 | 4.6% |
[ 35.5% - 36.0% ] 35.71% | 22,030 | 15.4% |
[ 36.0% - 36.5% ] 36.04% | 17,937 | 5.1% |
[ 36.5% - 37.0% ] 36.57% | 7,906 | 28.5% |
[ 37.0% - 37.5% ] 37.16% | 1,601 | 47.6% |
[ 38.0% - 38.5% ] 38.19% | 11,355 | 12.5% |
[ 38.5% - 39.0% ] 38.60% | 329 | 33.3% |
[ 39.0% - 39.5% ] 39.30% | 54,934 | 7.2% |
[ 44.0% - 44.5% ] 44.44% | 36 | 100.0% |
[ 44.5% - 45.0% ] 44.62% | 845 | 100.0% |
[ 47.0% - 47.5% ] 47.15% | 2,700 | 38.8% |
[ 50.5% - 51.0% ] 50.86% | 810 | 100.0% |
[ 53.0% - 53.5% ] 53.09% | 518 | 100.0% |
[ 59.5% - 60.0% ] 59.56% | 225 | 41.7% |
[ 67.0% - 67.5% ] 67.17% | 198 | 100.0% |