Immigrants from Uruguay 1 or more Vehicles in Household

COMPARE

Immigrants from Uruguay
Race
Ancestry
AfghanAfricanAlaska NativeAlaskan AthabascanAlbanianAleutAlsatianAmericanApacheArabArapahoArgentineanArmenianAssyrian/Chaldean/SyriacAustralianAustrianBahamianBangladeshiBarbadianBasqueBelgianBelizeanBermudanBhutaneseBlackfeetBolivianBrazilianBritishBritish West IndianBulgarianBurmeseCajunCambodianCanadianCape VerdeanCarpatho RusynCelticCentral AmericanCentral American IndianCherokeeCheyenneChickasawChileanChineseChippewaChoctawColombianColvilleComancheCosta RicanCreeCreekCroatianCrowCubanCypriotCzechCzechoslovakianDanishDelawareDominicanDutchDutch West IndianEastern EuropeanEcuadorianEgyptianEnglishEstonianEthiopianEuropeanFijianFilipinoFinnishFrenchFrench American IndianFrench CanadianGermanGerman RussianGhanaianGreekGuamanian/ChamorroGuatemalanGuyaneseHaitianHmongHonduranHopiHoumaHungarianIcelanderIndian (Asian)IndonesianInupiatIranianIraqiIrishIroquoisIsraeliItalianJamaicanJapaneseJordanianKenyanKiowaKoreanLaotianLatvianLebaneseLiberianLithuanianLumbeeLuxembourgerMacedonianMalaysianMalteseMarshalleseMenomineeMexicanMexican American IndianMongolianMoroccanNative HawaiianNavajoNepaleseNew ZealanderNicaraguanNigerianNorthern EuropeanNorwegianOkinawanOsageOttawaPaiutePakistaniPalestinianPanamanianParaguayanPennsylvania GermanPeruvianPimaPolishPortuguesePotawatomiPuebloPuerto RicanPuget Sound SalishRomanianRussianSalvadoranSamoanScandinavianScotch-IrishScottishSeminoleSenegaleseSerbianShoshoneSierra LeoneanSiouxSlavicSlovakSloveneSomaliSouth AfricanSouth AmericanSouth American IndianSoviet UnionSpaniardSpanishSpanish AmericanSpanish American IndianSri LankanSubsaharan AfricanSudaneseSwedishSwissSyrianTaiwaneseThaiTlingit-HaidaTohono O'OdhamTonganTrinidadian and TobagonianTsimshianTurkishU.S. Virgin IslanderUgandanUkrainianUruguayanUteVenezuelanVietnameseWelshWest IndianYakamaYaquiYugoslavianYumanYup'ikZimbabwean
Immigration
NonimmigrantsImmigrantsAfghanistanAfricaAlbaniaArgentinaArmeniaAsiaAustraliaAustriaBahamasBangladeshBarbadosBelarusBelgiumBelizeBoliviaBosnia and HerzegovinaBrazilBulgariaBurma/MyanmarCabo VerdeCambodiaCameroonCanadaCaribbeanCentral AmericaChileChinaColombiaCongoCosta RicaCroatiaCubaCzechoslovakiaDenmarkDominicaDominican RepublicEastern AfricaEastern AsiaEastern EuropeEcuadorEgyptEl SalvadorEnglandEritreaEthiopiaEuropeFijiFranceGermanyGhanaGreeceGrenadaGuatemalaGuyanaHaitiHondurasHong KongHungaryIndiaIndonesiaIranIraqIrelandIsraelItalyJamaicaJapanJordanKazakhstanKenyaKoreaKuwaitLaosLatin AmericaLatviaLebanonLiberiaLithuaniaMalaysiaMexicoMicronesiaMiddle AfricaMoldovaMoroccoNepalNetherlandsNicaraguaNigeriaNorth AmericaNorth MacedoniaNorthern AfricaNorthern EuropeNorwayOceaniaPakistanPanamaPeruPhilippinesPolandPortugalRomaniaRussiaSaudi ArabiaScotlandSenegalSerbiaSierra LeoneSingaporeSomaliaSouth AfricaSouth AmericaSouth Central AsiaSouth Eastern AsiaSouthern EuropeSpainSri LankaSt. Vincent and the GrenadinesSudanSwedenSwitzerlandSyriaTaiwanThailandTrinidad and TobagoTurkeyUgandaUkraineUruguayUzbekistanVenezuelaVietnamWest IndiesWestern AfricaWestern AsiaWestern EuropeYemenZaireZimbabweAzores
Select to Compare
Race
Ancestry
AfghanAfricanAlaska NativeAlaskan AthabascanAlbanianAleutAlsatianAmericanApacheArabArapahoArgentineanArmenianAssyrian/Chaldean/SyriacAustralianAustrianBahamianBangladeshiBarbadianBasqueBelgianBelizeanBermudanBhutaneseBlackfeetBolivianBrazilianBritishBritish West IndianBulgarianBurmeseCajunCambodianCanadianCape VerdeanCarpatho RusynCelticCentral AmericanCentral American IndianCherokeeCheyenneChickasawChileanChineseChippewaChoctawColombianColvilleComancheCosta RicanCreeCreekCroatianCrowCubanCypriotCzechCzechoslovakianDanishDelawareDominicanDutchDutch West IndianEastern EuropeanEcuadorianEgyptianEnglishEstonianEthiopianEuropeanFijianFilipinoFinnishFrenchFrench American IndianFrench CanadianGermanGerman RussianGhanaianGreekGuamanian/ChamorroGuatemalanGuyaneseHaitianHmongHonduranHopiHoumaHungarianIcelanderIndian (Asian)IndonesianInupiatIranianIraqiIrishIroquoisIsraeliItalianJamaicanJapaneseJordanianKenyanKiowaKoreanLaotianLatvianLebaneseLiberianLithuanianLumbeeLuxembourgerMacedonianMalaysianMalteseMarshalleseMenomineeMexicanMexican American IndianMongolianMoroccanNative HawaiianNavajoNepaleseNew ZealanderNicaraguanNigerianNorthern EuropeanNorwegianOkinawanOsageOttawaPaiutePakistaniPalestinianPanamanianParaguayanPennsylvania GermanPeruvianPimaPolishPortuguesePotawatomiPuebloPuerto RicanPuget Sound SalishRomanianRussianSalvadoranSamoanScandinavianScotch-IrishScottishSeminoleSenegaleseSerbianShoshoneSierra LeoneanSiouxSlavicSlovakSloveneSomaliSouth AfricanSouth AmericanSouth American IndianSoviet UnionSpaniardSpanishSpanish AmericanSpanish American IndianSri LankanSubsaharan AfricanSudaneseSwedishSwissSyrianTaiwaneseThaiTlingit-HaidaTohono O'OdhamTonganTrinidadian and TobagonianTsimshianTurkishU.S. Virgin IslanderUgandanUkrainianUruguayanUteVenezuelanVietnameseWelshWest IndianYakamaYaquiYugoslavianYumanYup'ikZimbabwean
Immigration
NonimmigrantsImmigrantsAfghanistanAfricaAlbaniaArgentinaArmeniaAsiaAustraliaAustriaBahamasBangladeshBarbadosBelarusBelgiumBelizeBoliviaBosnia and HerzegovinaBrazilBulgariaBurma/MyanmarCabo VerdeCambodiaCameroonCanadaCaribbeanCentral AmericaChileChinaColombiaCongoCosta RicaCroatiaCubaCzechoslovakiaDenmarkDominicaDominican RepublicEastern AfricaEastern AsiaEastern EuropeEcuadorEgyptEl SalvadorEnglandEritreaEthiopiaEuropeFijiFranceGermanyGhanaGreeceGrenadaGuatemalaGuyanaHaitiHondurasHong KongHungaryIndiaIndonesiaIranIraqIrelandIsraelItalyJamaicaJapanJordanKazakhstanKenyaKoreaKuwaitLaosLatin AmericaLatviaLebanonLiberiaLithuaniaMalaysiaMexicoMicronesiaMiddle AfricaMoldovaMoroccoNepalNetherlandsNicaraguaNigeriaNorth AmericaNorth MacedoniaNorthern AfricaNorthern EuropeNorwayOceaniaPakistanPanamaPeruPhilippinesPolandPortugalRomaniaRussiaSaudi ArabiaScotlandSenegalSerbiaSierra LeoneSingaporeSomaliaSouth AfricaSouth AmericaSouth Central AsiaSouth Eastern AsiaSouthern EuropeSpainSri LankaSt. Vincent and the GrenadinesSudanSwedenSwitzerlandSyriaTaiwanThailandTrinidad and TobagoTurkeyUgandaUkraineUzbekistanVenezuelaVietnamWest IndiesWestern AfricaWestern AsiaWestern EuropeYemenZaireZimbabweAzores
1 or more Vehicles in Household
Income
Poverty
Unemployment
Labor Participation
Family Structure
Vehicle Availability
Education Level
Disability

Immigrants from Uruguay 1 or more Vehicles in Household
Tragic

88.1%
1+ VEHICLES AVAILABLE
1.1/ 100
METRIC RATING
252nd/ 347
METRIC RANK

Immigrants from Uruguay 1 or more Vehicles in Household Correlation Chart

The statistical analysis conducted on geographies consisting of 133,245,142 people shows a substantial positive correlation between the proportion of Immigrants from Uruguay and percentage of households with 1 or more vehicles available in the United States with a correlation coefficient (R) of 0.525 and weighted average of 88.1%. On average, for every 1% (one percent) increase in Immigrants from Uruguay within a typical geography, there is an increase of 0.31% in percentage of households with 1 or more vehicles available.
Immigrants from Uruguay 1 or more Vehicles in Household
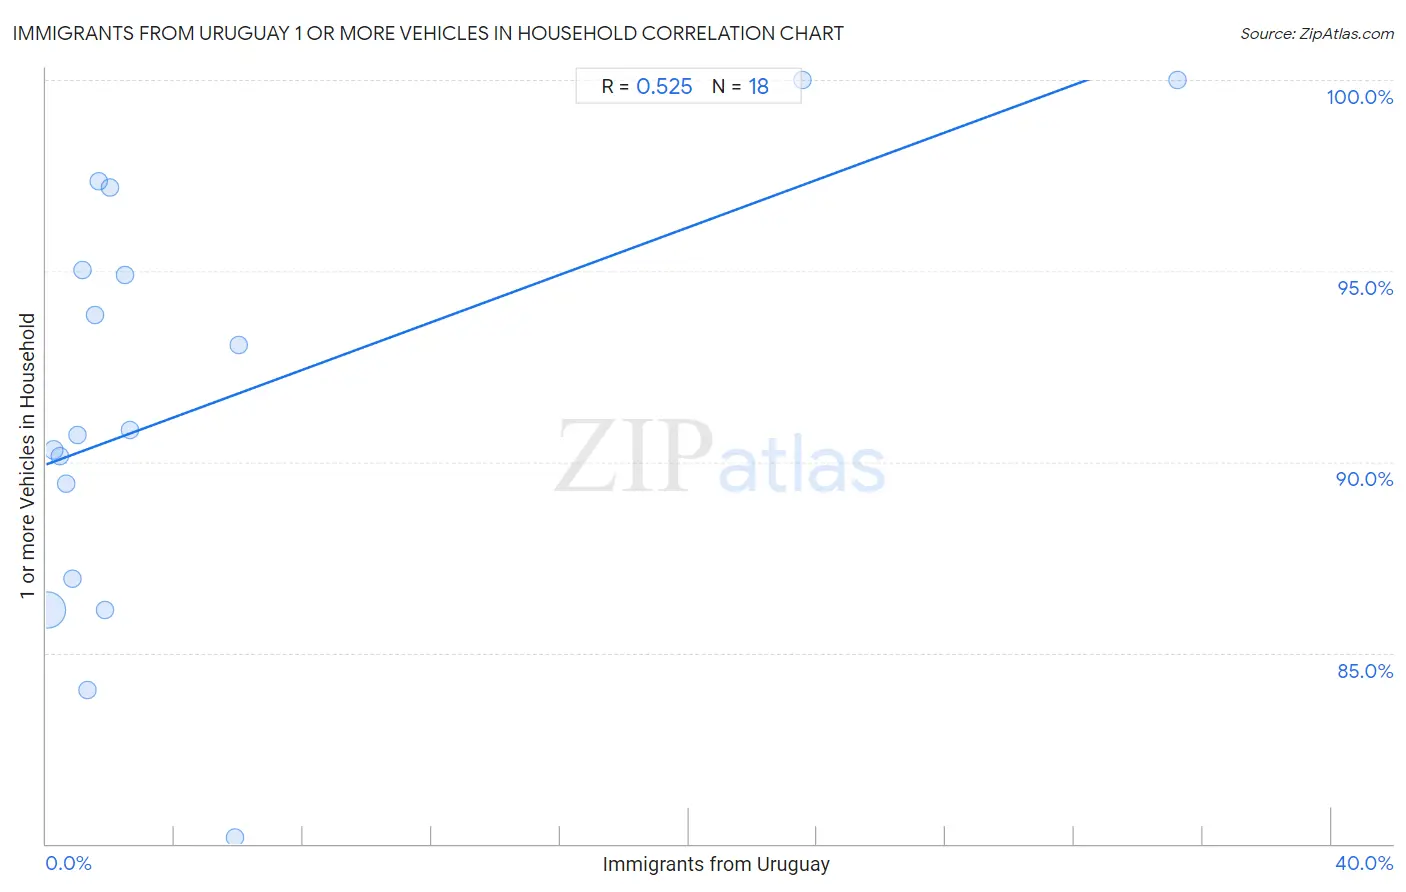
It is essential to understand that the correlation between the percentage of Immigrants from Uruguay and percentage of households with 1 or more vehicles available does not imply a direct cause-and-effect relationship. It remains uncertain whether the presence of Immigrants from Uruguay influences an upward or downward trend in the level of percentage of households with 1 or more vehicles available within an area, or if Immigrants from Uruguay simply ended up residing in those areas with higher or lower levels of percentage of households with 1 or more vehicles available due to other factors.

Demographics Similar to Immigrants from Uruguay by 1 or more Vehicles in Household

In terms of 1 or more vehicles in household, the demographic groups most similar to Immigrants from Uruguay are Honduran (88.1%, a difference of 0.030%), Haitian (88.1%, a difference of 0.040%), Immigrants from Serbia (88.2%, a difference of 0.050%), Egyptian (88.2%, a difference of 0.060%), and Immigrants from Latvia (88.1%, a difference of 0.060%).
DemographicsRating | Rank1 or more Vehicles in Household
Immigrants from Czechoslovakia
1.9
/100
|
#245
Tragic
88.3%
Menominee
1.9
/100
|
#246
Tragic
88.3%
Immigrants from Honduras
1.7
/100
|
#247
Tragic
88.3%
Immigrants from Nigeria
1.5
/100
|
#248
Tragic
88.2%
Blacks/African Americans
1.4
/100
|
#249
Tragic
88.2%
Egyptians
1.2
/100
|
#250
Tragic
88.2%
Immigrants from Serbia
1.2
/100
|
#251
Tragic
88.2%
Immigrants from Uruguay
1.1
/100
|
#252
Tragic
88.1%
Hondurans
1.0
/100
|
#253
Tragic
88.1%
Haitians
0.9
/100
|
#254
Tragic
88.1%
Immigrants from Latvia
0.9
/100
|
#255
Tragic
88.1%
Colombians
0.9
/100
|
#256
Tragic
88.0%
Liberians
0.9
/100
|
#257
Tragic
88.0%
South American Indians
0.9
/100
|
#258
Tragic
88.0%
Nigerians
0.8
/100
|
#259
Tragic
88.0%

Immigrants from Uruguay 1 or more Vehicles in Household Correlation Summary

MeasurementImmigrants from Uruguay Data1 or more Vehicles in Household Data
Minimum0.035%80.2%
Maximum35.2%100.0%
Range35.2%19.8%
Mean4.9%91.5%
Median1.6%90.8%
Interquartile 25% (IQ1)0.81%87.0%
Interquartile 75% (IQ3)2.6%95.0%
Interquartile Range (IQR)1.8%8.1%
Standard Deviation (Sample)9.3%5.5%
Standard Deviation (Population)9.0%5.3%

Correlation Details

Immigrants from Uruguay PercentileSample Size1 or more Vehicles in Household
[
0.0%
-
0.5%
]
0.035%
119,951,39986.1%
[
0.0%
-
0.5%
]
0.24%
8,941,36790.3%
[
0.0%
-
0.5%
]
0.41%
2,020,06190.2%
[
0.5%
-
1.0%
]
0.61%
1,020,00689.4%
[
0.5%
-
1.0%
]
0.81%
589,92487.0%
[
0.5%
-
1.0%
]
0.98%
195,40390.7%
[
1.0%
-
1.5%
]
1.13%
208,28795.0%
[
1.0%
-
1.5%
]
1.30%
124,60684.0%
[
1.5%
-
2.0%
]
1.52%
28,13793.8%
[
1.5%
-
2.0%
]
1.63%
3,86897.3%
[
1.5%
-
2.0%
]
1.84%
145,53186.1%
[
1.5%
-
2.0%
]
2.00%
9,11997.2%
[
2.0%
-
2.5%
]
2.46%
3,86494.9%
[
2.5%
-
3.0%
]
2.60%
1,84990.8%
[
5.5%
-
6.0%
]
5.87%
1,19280.2%
[
6.0%
-
6.5%
]
6.00%
25093.1%
[
23.5%
-
24.0%
]
23.56%
191100.0%
[
35.0%
-
35.5%
]
35.23%
88100.0%