Immigrants from Latvia 1 or more Vehicles in Household
COMPARE
Immigrants from Latvia
Select to Compare
1 or more Vehicles in Household
Immigrants from Latvia 1 or more Vehicles in Household
88.1%
1+ VEHICLES AVAILABLE
0.9/ 100
METRIC RATING
255th/ 347
METRIC RANK
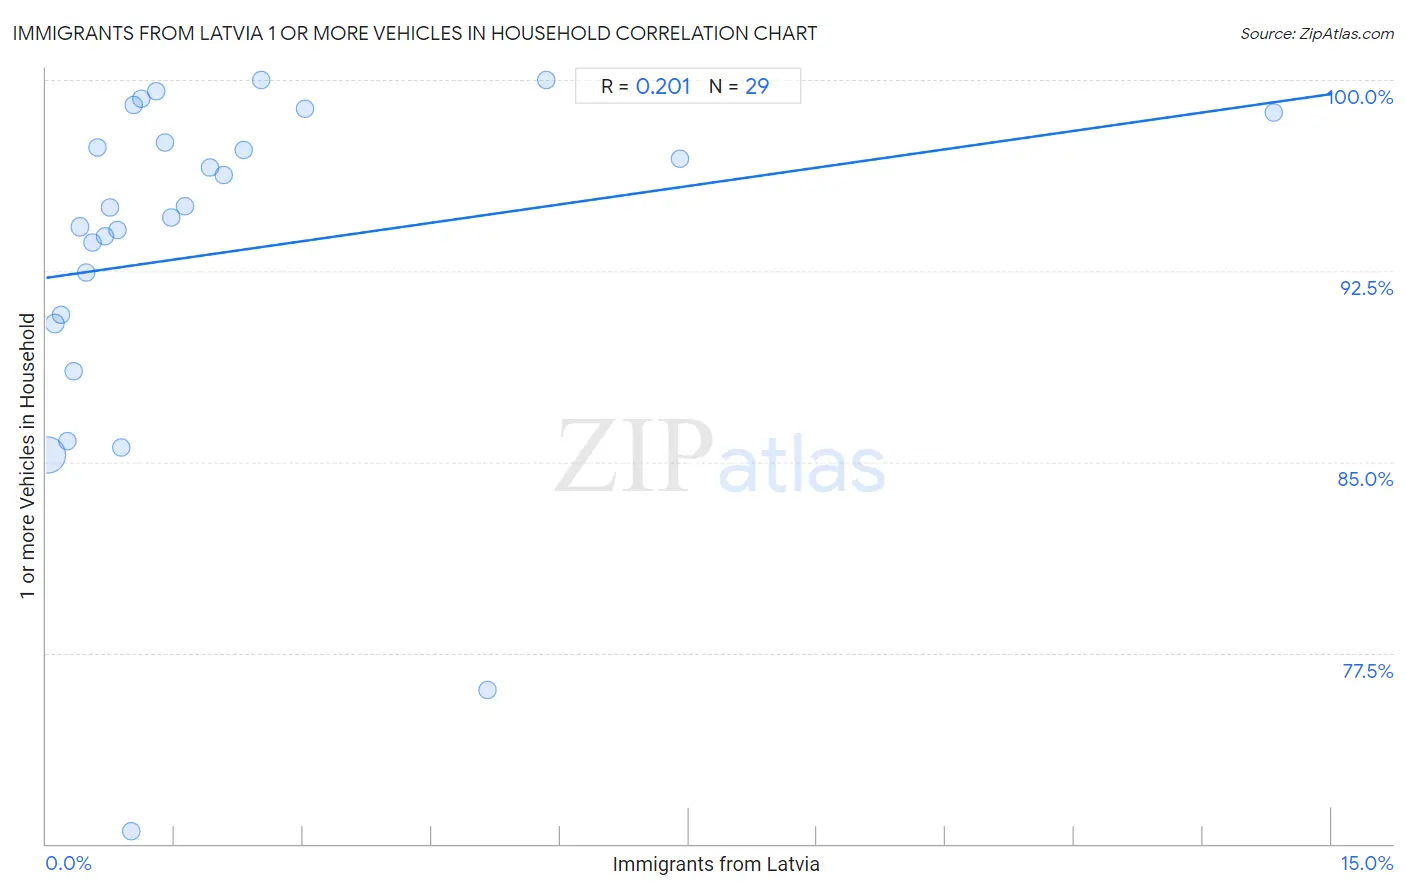
Immigrants from Latvia 1 or more Vehicles in Household Correlation Chart
The statistical analysis conducted on geographies consisting of 113,728,237 people shows a weak positive correlation between the proportion of Immigrants from Latvia and percentage of households with 1 or more vehicles available in the United States with a correlation coefficient (R) of 0.201 and weighted average of 88.1%. On average, for every 1% (one percent) increase in Immigrants from Latvia within a typical geography, there is an increase of 0.48% in percentage of households with 1 or more vehicles available.
It is essential to understand that the correlation between the percentage of Immigrants from Latvia and percentage of households with 1 or more vehicles available does not imply a direct cause-and-effect relationship. It remains uncertain whether the presence of Immigrants from Latvia influences an upward or downward trend in the level of percentage of households with 1 or more vehicles available within an area, or if Immigrants from Latvia simply ended up residing in those areas with higher or lower levels of percentage of households with 1 or more vehicles available due to other factors.
Demographics Similar to Immigrants from Latvia by 1 or more Vehicles in Household
In terms of 1 or more vehicles in household, the demographic groups most similar to Immigrants from Latvia are Colombian (88.0%, a difference of 0.010%), Liberian (88.0%, a difference of 0.010%), South American Indian (88.0%, a difference of 0.010%), Haitian (88.1%, a difference of 0.020%), and Honduran (88.1%, a difference of 0.030%).
| Demographics | Rating | Rank | 1 or more Vehicles in Household |
| Immigrants from Nigeria | 1.5 /100 | #248 | Tragic 88.2% |
| Blacks/African Americans | 1.4 /100 | #249 | Tragic 88.2% |
| Egyptians | 1.2 /100 | #250 | Tragic 88.2% |
| Immigrants from Serbia | 1.2 /100 | #251 | Tragic 88.2% |
| Immigrants from Uruguay | 1.1 /100 | #252 | Tragic 88.1% |
| Hondurans | 1.0 /100 | #253 | Tragic 88.1% |
| Haitians | 0.9 /100 | #254 | Tragic 88.1% |
| Immigrants from Latvia | 0.9 /100 | #255 | Tragic 88.1% |
| Colombians | 0.9 /100 | #256 | Tragic 88.0% |
| Liberians | 0.9 /100 | #257 | Tragic 88.0% |
| South American Indians | 0.9 /100 | #258 | Tragic 88.0% |
| Nigerians | 0.8 /100 | #259 | Tragic 88.0% |
| Macedonians | 0.6 /100 | #260 | Tragic 87.9% |
| Immigrants from Switzerland | 0.6 /100 | #261 | Tragic 87.9% |
| Sub-Saharan Africans | 0.5 /100 | #262 | Tragic 87.9% |
Immigrants from Latvia 1 or more Vehicles in Household Correlation Summary
| Measurement | Immigrants from Latvia Data | 1 or more Vehicles in Household Data |
| Minimum | 0.020% | 70.5% |
| Maximum | 14.3% | 100.0% |
| Range | 14.3% | 29.5% |
| Mean | 2.0% | 93.2% |
| Median | 1.0% | 95.0% |
| Interquartile 25% (IQ1) | 0.50% | 90.6% |
| Interquartile 75% (IQ3) | 2.2% | 98.1% |
| Interquartile Range (IQR) | 1.7% | 7.5% |
| Standard Deviation (Sample) | 2.9% | 7.0% |
| Standard Deviation (Population) | 2.9% | 6.9% |
Correlation Details
| Immigrants from Latvia Percentile | Sample Size | 1 or more Vehicles in Household |
[ 0.0% - 0.5% ] 0.020% | 100,030,257 | 85.3% |
[ 0.0% - 0.5% ] 0.100% | 8,834,339 | 90.4% |
[ 0.0% - 0.5% ] 0.17% | 2,277,749 | 90.8% |
[ 0.0% - 0.5% ] 0.25% | 1,192,672 | 85.8% |
[ 0.0% - 0.5% ] 0.32% | 586,375 | 88.6% |
[ 0.0% - 0.5% ] 0.40% | 336,986 | 94.2% |
[ 0.0% - 0.5% ] 0.46% | 147,336 | 92.5% |
[ 0.5% - 1.0% ] 0.54% | 68,192 | 93.6% |
[ 0.5% - 1.0% ] 0.60% | 26,740 | 97.4% |
[ 0.5% - 1.0% ] 0.69% | 66,500 | 93.8% |
[ 0.5% - 1.0% ] 0.74% | 16,697 | 95.0% |
[ 0.5% - 1.0% ] 0.83% | 11,054 | 94.1% |
[ 0.5% - 1.0% ] 0.87% | 72,929 | 85.5% |
[ 0.5% - 1.0% ] 0.99% | 4,528 | 70.5% |
[ 1.0% - 1.5% ] 1.02% | 7,149 | 99.0% |
[ 1.0% - 1.5% ] 1.11% | 5,404 | 99.3% |
[ 1.0% - 1.5% ] 1.29% | 1,240 | 99.6% |
[ 1.0% - 1.5% ] 1.39% | 4,248 | 97.5% |
[ 1.0% - 1.5% ] 1.46% | 12,995 | 94.6% |
[ 1.5% - 2.0% ] 1.62% | 2,036 | 95.1% |
[ 1.5% - 2.0% ] 1.91% | 7,897 | 96.6% |
[ 2.0% - 2.5% ] 2.08% | 771 | 96.3% |
[ 2.0% - 2.5% ] 2.30% | 564 | 97.3% |
[ 2.5% - 3.0% ] 2.51% | 279 | 100.0% |
[ 3.0% - 3.5% ] 3.03% | 8,425 | 98.9% |
[ 5.0% - 5.5% ] 5.16% | 349 | 76.0% |
[ 5.5% - 6.0% ] 5.83% | 223 | 100.0% |
[ 7.0% - 7.5% ] 7.39% | 2,313 | 96.9% |
[ 14.0% - 14.5% ] 14.32% | 1,990 | 98.7% |