Immigrants from Hungary GED/Equivalency
COMPARE
Immigrants from Hungary
Select to Compare
GED/Equivalency
Immigrants from Hungary GED/Equivalency
87.2%
GED/EQUIVALENCY
96.0/ 100
METRIC RATING
104th/ 347
METRIC RANK
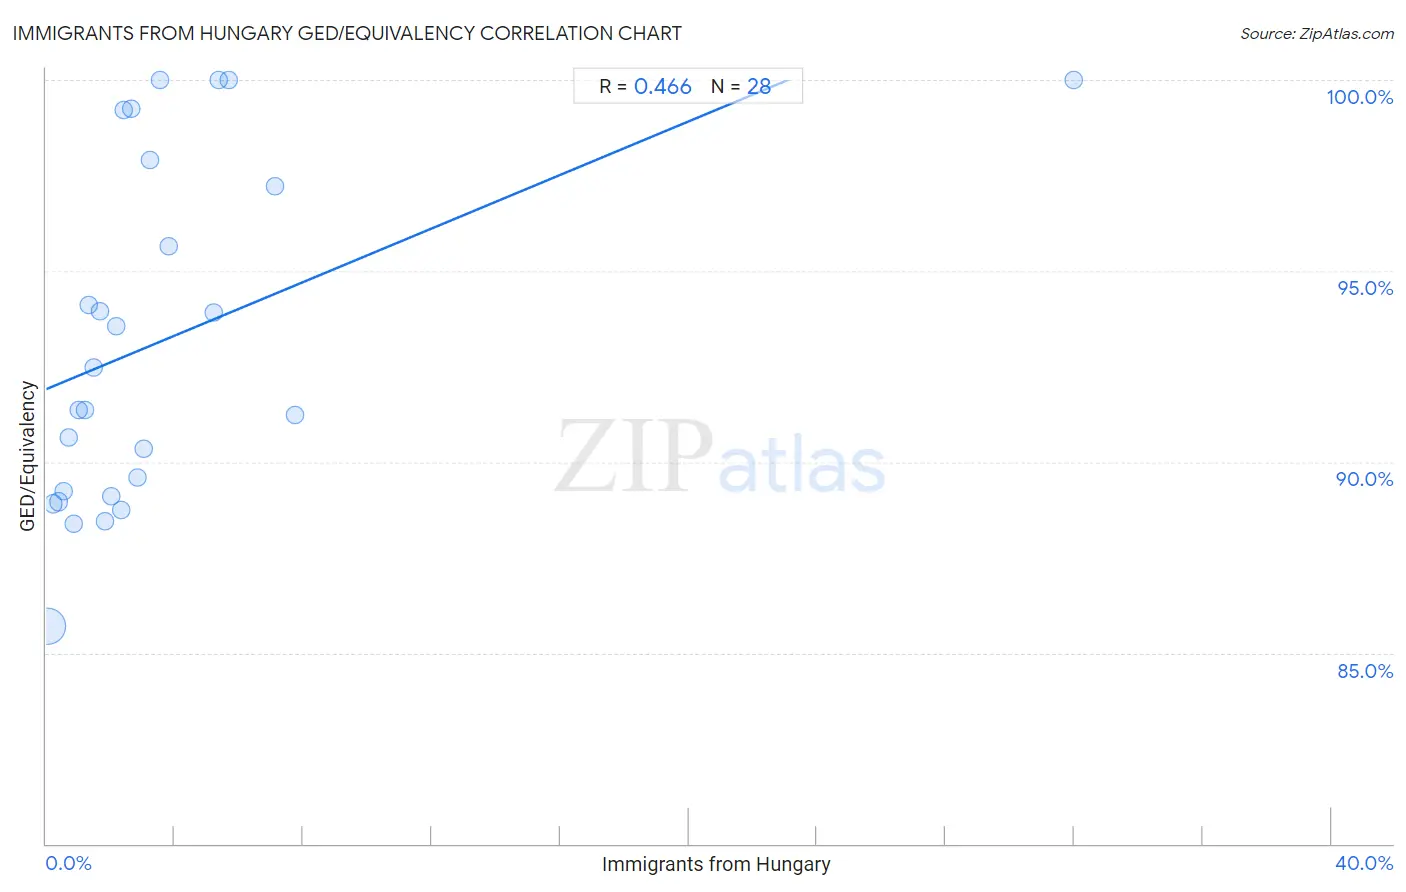
Immigrants from Hungary GED/Equivalency Correlation Chart
The statistical analysis conducted on geographies consisting of 195,707,305 people shows a moderate positive correlation between the proportion of Immigrants from Hungary and percentage of population with at least ged/equivalency education in the United States with a correlation coefficient (R) of 0.466 and weighted average of 87.2%. On average, for every 1% (one percent) increase in Immigrants from Hungary within a typical geography, there is an increase of 0.35% in percentage of population with at least ged/equivalency education.
It is essential to understand that the correlation between the percentage of Immigrants from Hungary and percentage of population with at least ged/equivalency education does not imply a direct cause-and-effect relationship. It remains uncertain whether the presence of Immigrants from Hungary influences an upward or downward trend in the level of percentage of population with at least ged/equivalency education within an area, or if Immigrants from Hungary simply ended up residing in those areas with higher or lower levels of percentage of population with at least ged/equivalency education due to other factors.
Demographics Similar to Immigrants from Hungary by GED/Equivalency
In terms of ged/equivalency, the demographic groups most similar to Immigrants from Hungary are Jordanian (87.2%, a difference of 0.010%), Indian (Asian) (87.1%, a difference of 0.010%), Lebanese (87.2%, a difference of 0.020%), Immigrants from Zimbabwe (87.1%, a difference of 0.030%), and Icelander (87.1%, a difference of 0.030%).
| Demographics | Rating | Rank | GED/Equivalency |
| Immigrants from Western Europe | 97.3 /100 | #97 | Exceptional 87.3% |
| Immigrants from Croatia | 96.9 /100 | #98 | Exceptional 87.3% |
| Immigrants from Belarus | 96.9 /100 | #99 | Exceptional 87.3% |
| Palestinians | 96.8 /100 | #100 | Exceptional 87.3% |
| Syrians | 96.6 /100 | #101 | Exceptional 87.2% |
| Lebanese | 96.2 /100 | #102 | Exceptional 87.2% |
| Jordanians | 96.1 /100 | #103 | Exceptional 87.2% |
| Immigrants from Hungary | 96.0 /100 | #104 | Exceptional 87.2% |
| Indians (Asian) | 95.9 /100 | #105 | Exceptional 87.1% |
| Immigrants from Zimbabwe | 95.8 /100 | #106 | Exceptional 87.1% |
| Icelanders | 95.7 /100 | #107 | Exceptional 87.1% |
| Canadians | 95.6 /100 | #108 | Exceptional 87.1% |
| Immigrants from Eastern Europe | 95.5 /100 | #109 | Exceptional 87.1% |
| Egyptians | 95.3 /100 | #110 | Exceptional 87.1% |
| French | 95.2 /100 | #111 | Exceptional 87.1% |
Immigrants from Hungary GED/Equivalency Correlation Summary
| Measurement | Immigrants from Hungary Data | GED/Equivalency Data |
| Minimum | 0.039% | 85.7% |
| Maximum | 32.0% | 100.0% |
| Range | 32.0% | 14.3% |
| Mean | 3.7% | 93.2% |
| Median | 2.3% | 91.9% |
| Interquartile 25% (IQ1) | 1.1% | 89.2% |
| Interquartile 75% (IQ3) | 3.7% | 97.6% |
| Interquartile Range (IQR) | 2.6% | 8.4% |
| Standard Deviation (Sample) | 5.9% | 4.4% |
| Standard Deviation (Population) | 5.8% | 4.4% |
Correlation Details
| Immigrants from Hungary Percentile | Sample Size | GED/Equivalency |
[ 0.0% - 0.5% ] 0.039% | 180,562,942 | 85.7% |
[ 0.0% - 0.5% ] 0.22% | 11,027,323 | 88.9% |
[ 0.0% - 0.5% ] 0.39% | 2,396,424 | 89.0% |
[ 0.5% - 1.0% ] 0.55% | 1,005,616 | 89.2% |
[ 0.5% - 1.0% ] 0.70% | 304,010 | 90.6% |
[ 0.5% - 1.0% ] 0.87% | 129,377 | 88.4% |
[ 1.0% - 1.5% ] 1.01% | 47,444 | 91.4% |
[ 1.0% - 1.5% ] 1.19% | 84,971 | 91.4% |
[ 1.0% - 1.5% ] 1.31% | 6,499 | 94.1% |
[ 1.0% - 1.5% ] 1.49% | 50,070 | 92.5% |
[ 1.5% - 2.0% ] 1.69% | 15,069 | 93.9% |
[ 1.5% - 2.0% ] 1.81% | 1,987 | 88.4% |
[ 2.0% - 2.5% ] 2.02% | 34,658 | 89.1% |
[ 2.0% - 2.5% ] 2.19% | 11,295 | 93.6% |
[ 2.0% - 2.5% ] 2.33% | 1,546 | 88.7% |
[ 2.0% - 2.5% ] 2.43% | 4,902 | 99.2% |
[ 2.5% - 3.0% ] 2.65% | 3,968 | 99.3% |
[ 2.5% - 3.0% ] 2.84% | 598 | 89.6% |
[ 3.0% - 3.5% ] 3.03% | 8,612 | 90.4% |
[ 3.0% - 3.5% ] 3.23% | 124 | 97.9% |
[ 3.5% - 4.0% ] 3.54% | 2,741 | 100.0% |
[ 3.5% - 4.0% ] 3.81% | 1,599 | 95.7% |
[ 5.0% - 5.5% ] 5.20% | 1,174 | 93.9% |
[ 5.0% - 5.5% ] 5.38% | 1,803 | 100.0% |
[ 5.5% - 6.0% ] 5.68% | 546 | 100.0% |
[ 7.0% - 7.5% ] 7.13% | 603 | 97.2% |
[ 7.5% - 8.0% ] 7.76% | 1,379 | 91.2% |
[ 32.0% - 32.5% ] 32.00% | 25 | 100.0% |