Immigrants from Dominican Republic Married-couple Households
COMPARE
Immigrants from Dominican Republic
Select to Compare
Married-couple Households
Immigrants from Dominican Republic Married-couple Households
37.3%
MARRIED-COUPLE HOUSEHOLDS
0.0/ 100
METRIC RATING
344th/ 347
METRIC RANK
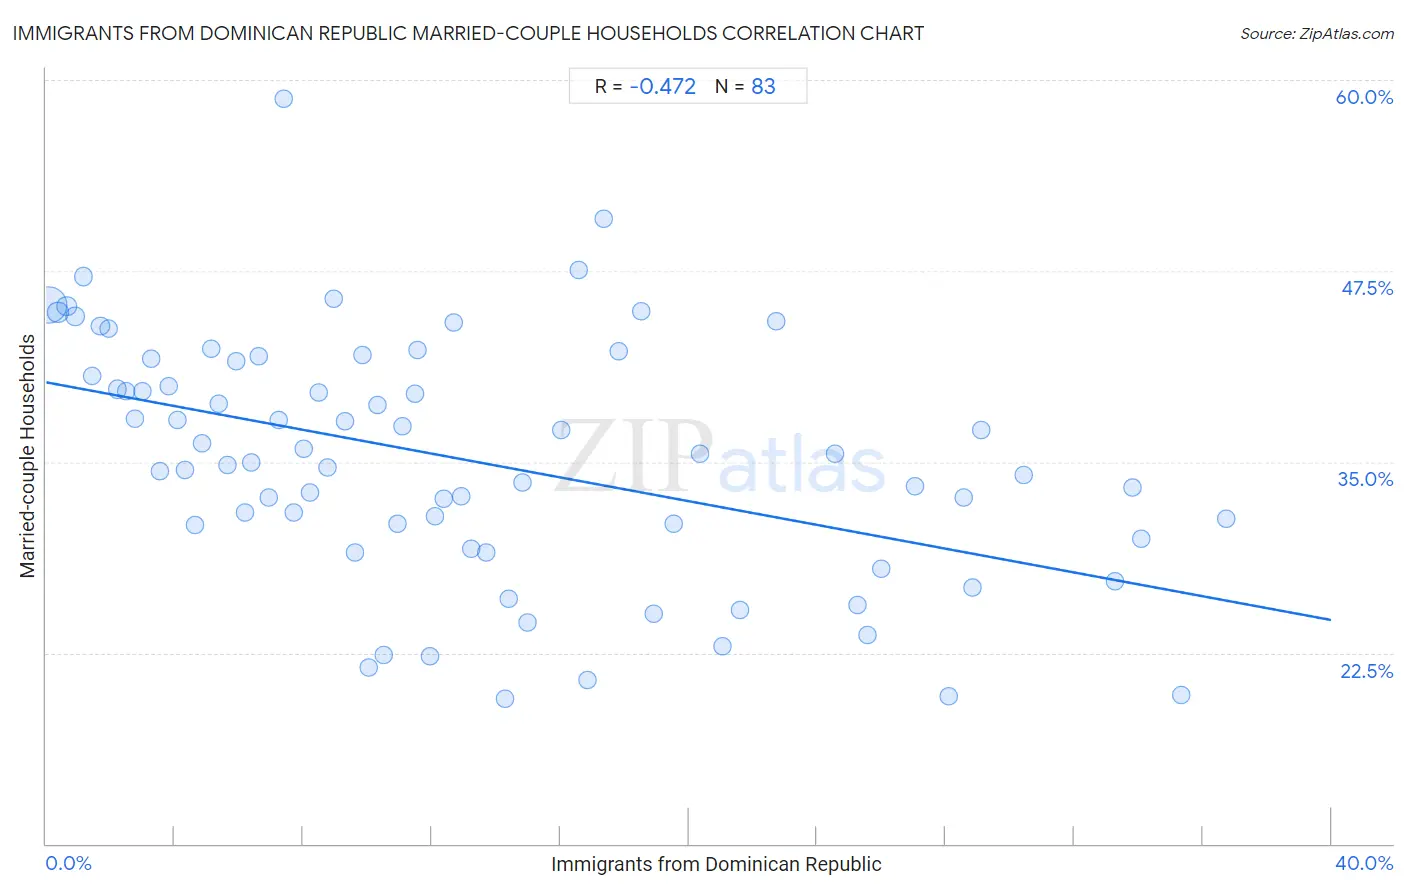
Immigrants from Dominican Republic Married-couple Households Correlation Chart
The statistical analysis conducted on geographies consisting of 274,963,123 people shows a moderate negative correlation between the proportion of Immigrants from Dominican Republic and percentage of married-couple family households in the United States with a correlation coefficient (R) of -0.472 and weighted average of 37.3%. On average, for every 1% (one percent) increase in Immigrants from Dominican Republic within a typical geography, there is a decrease of 0.39% in percentage of married-couple family households.
It is essential to understand that the correlation between the percentage of Immigrants from Dominican Republic and percentage of married-couple family households does not imply a direct cause-and-effect relationship. It remains uncertain whether the presence of Immigrants from Dominican Republic influences an upward or downward trend in the level of percentage of married-couple family households within an area, or if Immigrants from Dominican Republic simply ended up residing in those areas with higher or lower levels of percentage of married-couple family households due to other factors.
Demographics Similar to Immigrants from Dominican Republic by Married-couple Households
In terms of married-couple households, the demographic groups most similar to Immigrants from Dominican Republic are Immigrants from Grenada (37.5%, a difference of 0.43%), Tohono O'odham (37.9%, a difference of 1.5%), Hopi (36.7%, a difference of 1.8%), Cape Verdean (38.1%, a difference of 2.1%), and Dominican (38.2%, a difference of 2.2%).
| Demographics | Rating | Rank | Married-couple Households |
| Immigrants from West Indies | 0.0 /100 | #333 | Tragic 39.0% |
| Immigrants from St. Vincent and the Grenadines | 0.0 /100 | #334 | Tragic 38.7% |
| Senegalese | 0.0 /100 | #335 | Tragic 38.6% |
| Blacks/African Americans | 0.0 /100 | #336 | Tragic 38.5% |
| Immigrants from Somalia | 0.0 /100 | #337 | Tragic 38.4% |
| Immigrants from Senegal | 0.0 /100 | #338 | Tragic 38.4% |
| British West Indians | 0.0 /100 | #339 | Tragic 38.3% |
| Dominicans | 0.0 /100 | #340 | Tragic 38.2% |
| Cape Verdeans | 0.0 /100 | #341 | Tragic 38.1% |
| Tohono O'odham | 0.0 /100 | #342 | Tragic 37.9% |
| Immigrants from Grenada | 0.0 /100 | #343 | Tragic 37.5% |
| Immigrants from Dominican Republic | 0.0 /100 | #344 | Tragic 37.3% |
| Hopi | 0.0 /100 | #345 | Tragic 36.7% |
| Immigrants from Cabo Verde | 0.0 /100 | #346 | Tragic 36.2% |
| Pima | 0.0 /100 | #347 | Tragic 35.6% |
Immigrants from Dominican Republic Married-couple Households Correlation Summary
| Measurement | Immigrants from Dominican Republic Data | Married-couple Households Data |
| Minimum | 0.075% | 19.5% |
| Maximum | 36.7% | 58.7% |
| Range | 36.7% | 39.3% |
| Mean | 13.1% | 35.1% |
| Median | 11.0% | 34.9% |
| Interquartile 25% (IQ1) | 5.4% | 30.0% |
| Interquartile 75% (IQ3) | 18.9% | 41.6% |
| Interquartile Range (IQR) | 13.5% | 11.6% |
| Standard Deviation (Sample) | 9.7% | 8.0% |
| Standard Deviation (Population) | 9.7% | 7.9% |
Correlation Details
| Immigrants from Dominican Republic Percentile | Sample Size | Married-couple Households |
[ 0.0% - 0.5% ] 0.075% | 178,675,263 | 45.2% |
[ 0.0% - 0.5% ] 0.37% | 27,066,984 | 44.8% |
[ 0.5% - 1.0% ] 0.64% | 13,881,396 | 45.2% |
[ 0.5% - 1.0% ] 0.91% | 9,356,654 | 44.5% |
[ 1.0% - 1.5% ] 1.17% | 5,855,273 | 47.1% |
[ 1.0% - 1.5% ] 1.42% | 6,146,210 | 40.6% |
[ 1.5% - 2.0% ] 1.69% | 4,037,028 | 43.9% |
[ 1.5% - 2.0% ] 1.93% | 2,808,240 | 43.7% |
[ 2.0% - 2.5% ] 2.22% | 1,867,606 | 39.8% |
[ 2.0% - 2.5% ] 2.49% | 1,036,734 | 39.6% |
[ 2.5% - 3.0% ] 2.75% | 1,401,345 | 37.8% |
[ 3.0% - 3.5% ] 3.01% | 1,049,723 | 39.6% |
[ 3.0% - 3.5% ] 3.26% | 1,114,665 | 41.7% |
[ 3.5% - 4.0% ] 3.54% | 1,569,503 | 34.4% |
[ 3.5% - 4.0% ] 3.80% | 603,496 | 39.9% |
[ 4.0% - 4.5% ] 4.09% | 1,246,943 | 37.8% |
[ 4.0% - 4.5% ] 4.32% | 761,874 | 34.5% |
[ 4.5% - 5.0% ] 4.62% | 74,908 | 30.9% |
[ 4.5% - 5.0% ] 4.85% | 8,833,330 | 36.2% |
[ 5.0% - 5.5% ] 5.12% | 500,200 | 42.4% |
[ 5.0% - 5.5% ] 5.35% | 542,589 | 38.8% |
[ 5.5% - 6.0% ] 5.64% | 336,274 | 34.8% |
[ 5.5% - 6.0% ] 5.92% | 184,343 | 41.6% |
[ 6.0% - 6.5% ] 6.17% | 209,659 | 31.7% |
[ 6.0% - 6.5% ] 6.39% | 429,062 | 34.9% |
[ 6.5% - 7.0% ] 6.60% | 103,206 | 41.9% |
[ 6.5% - 7.0% ] 6.92% | 181,875 | 32.6% |
[ 7.0% - 7.5% ] 7.24% | 210,882 | 37.7% |
[ 7.0% - 7.5% ] 7.40% | 1,230 | 58.7% |
[ 7.5% - 8.0% ] 7.71% | 99,500 | 31.7% |
[ 8.0% - 8.5% ] 8.00% | 93,217 | 35.9% |
[ 8.0% - 8.5% ] 8.22% | 147,938 | 33.0% |
[ 8.0% - 8.5% ] 8.49% | 81,220 | 39.5% |
[ 8.5% - 9.0% ] 8.77% | 516,513 | 34.7% |
[ 8.5% - 9.0% ] 8.96% | 67,652 | 45.7% |
[ 9.0% - 9.5% ] 9.29% | 59,235 | 37.6% |
[ 9.5% - 10.0% ] 9.60% | 105,250 | 29.0% |
[ 9.5% - 10.0% ] 9.83% | 325,139 | 42.0% |
[ 10.0% - 10.5% ] 10.04% | 62,824 | 21.5% |
[ 10.0% - 10.5% ] 10.30% | 224,927 | 38.7% |
[ 10.5% - 11.0% ] 10.50% | 55,985 | 22.3% |
[ 10.5% - 11.0% ] 10.95% | 114,608 | 31.0% |
[ 11.0% - 11.5% ] 11.07% | 218,026 | 37.3% |
[ 11.0% - 11.5% ] 11.50% | 13,309 | 39.5% |
[ 11.5% - 12.0% ] 11.54% | 4,738 | 42.4% |
[ 11.5% - 12.0% ] 11.96% | 30,126 | 22.3% |
[ 12.0% - 12.5% ] 12.12% | 199,306 | 31.4% |
[ 12.0% - 12.5% ] 12.38% | 120,102 | 32.6% |
[ 12.5% - 13.0% ] 12.67% | 10,396 | 44.1% |
[ 12.5% - 13.0% ] 12.90% | 97,904 | 32.7% |
[ 13.0% - 13.5% ] 13.23% | 320,831 | 29.3% |
[ 13.5% - 14.0% ] 13.70% | 74,244 | 29.1% |
[ 14.0% - 14.5% ] 14.27% | 88,575 | 19.5% |
[ 14.0% - 14.5% ] 14.40% | 51,640 | 26.1% |
[ 14.5% - 15.0% ] 14.83% | 61,238 | 33.7% |
[ 14.5% - 15.0% ] 14.97% | 51,964 | 24.5% |
[ 16.0% - 16.5% ] 16.03% | 140,096 | 37.1% |
[ 16.5% - 17.0% ] 16.58% | 7,822 | 47.6% |
[ 16.5% - 17.0% ] 16.86% | 59,852 | 20.7% |
[ 17.0% - 17.5% ] 17.35% | 1,798 | 50.9% |
[ 17.5% - 18.0% ] 17.83% | 24,572 | 42.3% |
[ 18.5% - 19.0% ] 18.54% | 10,071 | 44.9% |
[ 18.5% - 19.0% ] 18.90% | 61,044 | 25.1% |
[ 19.5% - 20.0% ] 19.53% | 237,681 | 30.9% |
[ 20.0% - 20.5% ] 20.35% | 25,674 | 35.5% |
[ 21.0% - 21.5% ] 21.07% | 78,624 | 22.9% |
[ 21.5% - 22.0% ] 21.61% | 93,747 | 25.3% |
[ 22.5% - 23.0% ] 22.73% | 13,781 | 44.2% |
[ 24.5% - 25.0% ] 24.54% | 20,269 | 35.5% |
[ 25.0% - 25.5% ] 25.27% | 35,492 | 25.6% |
[ 25.5% - 26.0% ] 25.55% | 100,504 | 23.7% |
[ 25.5% - 26.0% ] 25.99% | 100,281 | 28.0% |
[ 27.0% - 27.5% ] 27.05% | 31,519 | 33.4% |
[ 28.0% - 28.5% ] 28.11% | 60,480 | 19.7% |
[ 28.5% - 29.0% ] 28.56% | 29,671 | 32.7% |
[ 28.5% - 29.0% ] 28.84% | 109,749 | 26.7% |
[ 29.0% - 29.5% ] 29.09% | 58,136 | 37.1% |
[ 30.0% - 30.5% ] 30.42% | 55,226 | 34.2% |
[ 33.0% - 33.5% ] 33.25% | 43,653 | 27.1% |
[ 33.5% - 34.0% ] 33.83% | 32,697 | 33.3% |
[ 34.0% - 34.5% ] 34.08% | 88,067 | 30.0% |
[ 35.0% - 35.5% ] 35.34% | 6,977 | 19.7% |
[ 36.5% - 37.0% ] 36.74% | 52,738 | 31.2% |