Immigrants from Croatia Master's Degree
COMPARE
Immigrants from Croatia
Select to Compare
Master's Degree
Immigrants from Croatia Master's Degree
17.3%
MASTER'S DEGREE
99.3/ 100
METRIC RATING
86th/ 347
METRIC RANK
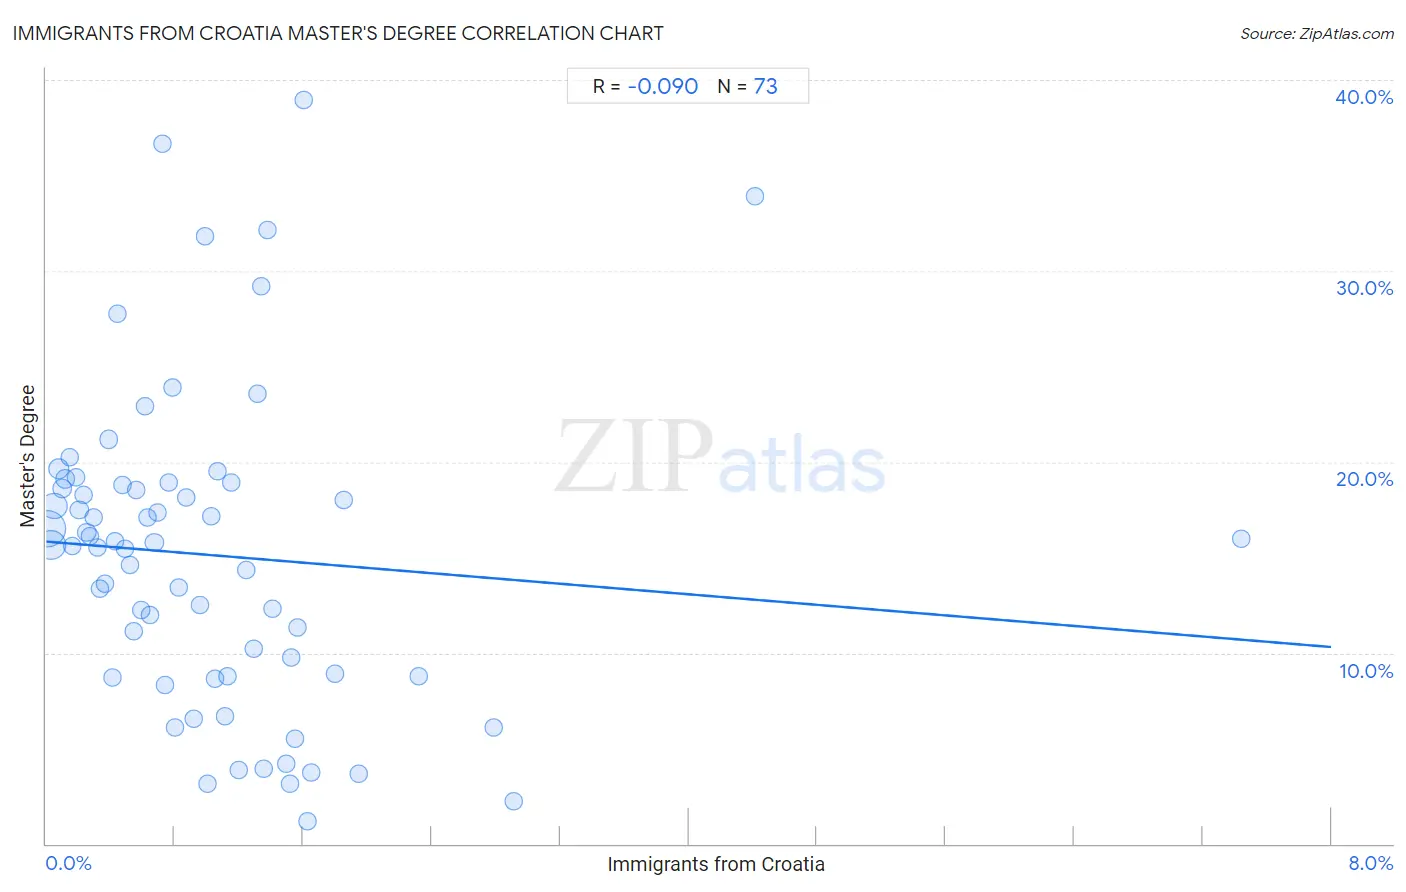
Immigrants from Croatia Master's Degree Correlation Chart
The statistical analysis conducted on geographies consisting of 132,554,836 people shows a slight negative correlation between the proportion of Immigrants from Croatia and percentage of population with at least master's degree education in the United States with a correlation coefficient (R) of -0.090 and weighted average of 17.3%. On average, for every 1% (one percent) increase in Immigrants from Croatia within a typical geography, there is a decrease of 0.69% in percentage of population with at least master's degree education.
It is essential to understand that the correlation between the percentage of Immigrants from Croatia and percentage of population with at least master's degree education does not imply a direct cause-and-effect relationship. It remains uncertain whether the presence of Immigrants from Croatia influences an upward or downward trend in the level of percentage of population with at least master's degree education within an area, or if Immigrants from Croatia simply ended up residing in those areas with higher or lower levels of percentage of population with at least master's degree education due to other factors.
Demographics Similar to Immigrants from Croatia by Master's Degree
In terms of master's degree, the demographic groups most similar to Immigrants from Croatia are Maltese (17.3%, a difference of 0.10%), Immigrants from Brazil (17.4%, a difference of 0.41%), Immigrants from Canada (17.2%, a difference of 0.46%), Bhutanese (17.2%, a difference of 0.53%), and Immigrants from Egypt (17.2%, a difference of 0.55%).
| Demographics | Rating | Rank | Master's Degree |
| Immigrants from Lebanon | 99.6 /100 | #79 | Exceptional 17.5% |
| Carpatho Rusyns | 99.6 /100 | #80 | Exceptional 17.5% |
| Immigrants from Western Asia | 99.5 /100 | #81 | Exceptional 17.5% |
| Greeks | 99.5 /100 | #82 | Exceptional 17.5% |
| Immigrants from Zimbabwe | 99.5 /100 | #83 | Exceptional 17.4% |
| Immigrants from Scotland | 99.4 /100 | #84 | Exceptional 17.4% |
| Immigrants from Brazil | 99.4 /100 | #85 | Exceptional 17.4% |
| Immigrants from Croatia | 99.3 /100 | #86 | Exceptional 17.3% |
| Maltese | 99.3 /100 | #87 | Exceptional 17.3% |
| Immigrants from Canada | 99.2 /100 | #88 | Exceptional 17.2% |
| Bhutanese | 99.1 /100 | #89 | Exceptional 17.2% |
| Immigrants from Egypt | 99.1 /100 | #90 | Exceptional 17.2% |
| Romanians | 99.1 /100 | #91 | Exceptional 17.2% |
| Immigrants from North America | 99.1 /100 | #92 | Exceptional 17.2% |
| Immigrants from Italy | 99.1 /100 | #93 | Exceptional 17.2% |
Immigrants from Croatia Master's Degree Correlation Summary
| Measurement | Immigrants from Croatia Data | Master's Degree Data |
| Minimum | 0.010% | 1.2% |
| Maximum | 7.4% | 39.0% |
| Range | 7.4% | 37.8% |
| Mean | 1.0% | 15.1% |
| Median | 0.80% | 15.7% |
| Interquartile 25% (IQ1) | 0.40% | 8.8% |
| Interquartile 75% (IQ3) | 1.4% | 18.8% |
| Interquartile Range (IQR) | 0.97% | 10.1% |
| Standard Deviation (Sample) | 1.1% | 8.2% |
| Standard Deviation (Population) | 1.1% | 8.1% |
Correlation Details
| Immigrants from Croatia Percentile | Sample Size | Master's Degree |
[ 0.0% - 0.5% ] 0.010% | 53,227,368 | 16.5% |
[ 0.0% - 0.5% ] 0.031% | 32,238,248 | 15.7% |
[ 0.0% - 0.5% ] 0.049% | 22,841,552 | 17.7% |
[ 0.0% - 0.5% ] 0.077% | 6,961,575 | 19.6% |
[ 0.0% - 0.5% ] 0.098% | 5,243,750 | 18.6% |
[ 0.0% - 0.5% ] 0.12% | 2,516,308 | 19.1% |
[ 0.0% - 0.5% ] 0.14% | 1,631,746 | 20.2% |
[ 0.0% - 0.5% ] 0.16% | 1,325,015 | 15.6% |
[ 0.0% - 0.5% ] 0.19% | 1,125,105 | 19.2% |
[ 0.0% - 0.5% ] 0.21% | 545,986 | 17.5% |
[ 0.0% - 0.5% ] 0.23% | 769,935 | 18.2% |
[ 0.0% - 0.5% ] 0.25% | 589,204 | 16.3% |
[ 0.0% - 0.5% ] 0.27% | 484,873 | 16.1% |
[ 0.0% - 0.5% ] 0.30% | 341,651 | 17.1% |
[ 0.0% - 0.5% ] 0.32% | 227,065 | 15.5% |
[ 0.0% - 0.5% ] 0.34% | 318,546 | 13.4% |
[ 0.0% - 0.5% ] 0.36% | 203,231 | 13.6% |
[ 0.0% - 0.5% ] 0.39% | 208,826 | 21.2% |
[ 0.0% - 0.5% ] 0.41% | 65,108 | 8.7% |
[ 0.0% - 0.5% ] 0.43% | 159,676 | 15.8% |
[ 0.0% - 0.5% ] 0.45% | 135,542 | 27.7% |
[ 0.0% - 0.5% ] 0.48% | 119,493 | 18.8% |
[ 0.0% - 0.5% ] 0.49% | 164,910 | 15.5% |
[ 0.5% - 1.0% ] 0.52% | 77,634 | 14.6% |
[ 0.5% - 1.0% ] 0.54% | 40,579 | 11.1% |
[ 0.5% - 1.0% ] 0.56% | 83,552 | 18.6% |
[ 0.5% - 1.0% ] 0.59% | 80,692 | 12.3% |
[ 0.5% - 1.0% ] 0.61% | 14,359 | 22.9% |
[ 0.5% - 1.0% ] 0.63% | 87,443 | 17.1% |
[ 0.5% - 1.0% ] 0.65% | 30,057 | 12.0% |
[ 0.5% - 1.0% ] 0.67% | 56,899 | 15.8% |
[ 0.5% - 1.0% ] 0.70% | 38,116 | 17.4% |
[ 0.5% - 1.0% ] 0.73% | 4,536 | 36.7% |
[ 0.5% - 1.0% ] 0.74% | 6,785 | 8.3% |
[ 0.5% - 1.0% ] 0.76% | 47,950 | 18.9% |
[ 0.5% - 1.0% ] 0.78% | 62,467 | 23.9% |
[ 0.5% - 1.0% ] 0.80% | 9,073 | 6.1% |
[ 0.5% - 1.0% ] 0.83% | 31,458 | 13.4% |
[ 0.5% - 1.0% ] 0.87% | 52,121 | 18.1% |
[ 0.5% - 1.0% ] 0.92% | 35,889 | 6.6% |
[ 0.5% - 1.0% ] 0.96% | 20,996 | 12.5% |
[ 0.5% - 1.0% ] 0.99% | 8,820 | 31.8% |
[ 1.0% - 1.5% ] 1.00% | 499 | 3.1% |
[ 1.0% - 1.5% ] 1.03% | 486 | 17.2% |
[ 1.0% - 1.5% ] 1.05% | 5,598 | 8.6% |
[ 1.0% - 1.5% ] 1.06% | 470 | 19.5% |
[ 1.0% - 1.5% ] 1.11% | 18,166 | 6.7% |
[ 1.0% - 1.5% ] 1.13% | 3,999 | 8.7% |
[ 1.0% - 1.5% ] 1.15% | 34,752 | 18.9% |
[ 1.0% - 1.5% ] 1.20% | 1,254 | 3.8% |
[ 1.0% - 1.5% ] 1.25% | 38,209 | 14.4% |
[ 1.0% - 1.5% ] 1.29% | 5,496 | 10.2% |
[ 1.0% - 1.5% ] 1.31% | 70,431 | 23.5% |
[ 1.0% - 1.5% ] 1.34% | 34,539 | 29.2% |
[ 1.0% - 1.5% ] 1.35% | 2,444 | 3.9% |
[ 1.0% - 1.5% ] 1.38% | 362 | 32.1% |
[ 1.0% - 1.5% ] 1.41% | 8,801 | 12.3% |
[ 1.0% - 1.5% ] 1.50% | 2,739 | 4.2% |
[ 1.5% - 2.0% ] 1.52% | 330 | 3.1% |
[ 1.5% - 2.0% ] 1.53% | 1,374 | 9.8% |
[ 1.5% - 2.0% ] 1.55% | 1,875 | 5.5% |
[ 1.5% - 2.0% ] 1.57% | 24,440 | 11.3% |
[ 1.5% - 2.0% ] 1.60% | 811 | 39.0% |
[ 1.5% - 2.0% ] 1.63% | 307 | 1.2% |
[ 1.5% - 2.0% ] 1.65% | 910 | 3.7% |
[ 1.5% - 2.0% ] 1.79% | 20,401 | 8.9% |
[ 1.5% - 2.0% ] 1.85% | 6,914 | 18.0% |
[ 1.5% - 2.0% ] 1.94% | 412 | 3.6% |
[ 2.0% - 2.5% ] 2.32% | 29,870 | 8.8% |
[ 2.5% - 3.0% ] 2.78% | 2,442 | 6.1% |
[ 2.5% - 3.0% ] 2.91% | 172 | 2.2% |
[ 4.0% - 4.5% ] 4.41% | 1,428 | 33.9% |
[ 7.0% - 7.5% ] 7.44% | 766 | 16.0% |