Immigrants from Colombia Disability Age Under 5
COMPARE
Immigrants from Colombia
Select to Compare
Disability Age Under 5
Immigrants from Colombia Disability Age Under 5
1.2%
DISABILITY | AGE UNDER 5
79.3/ 100
METRIC RATING
142nd/ 347
METRIC RANK
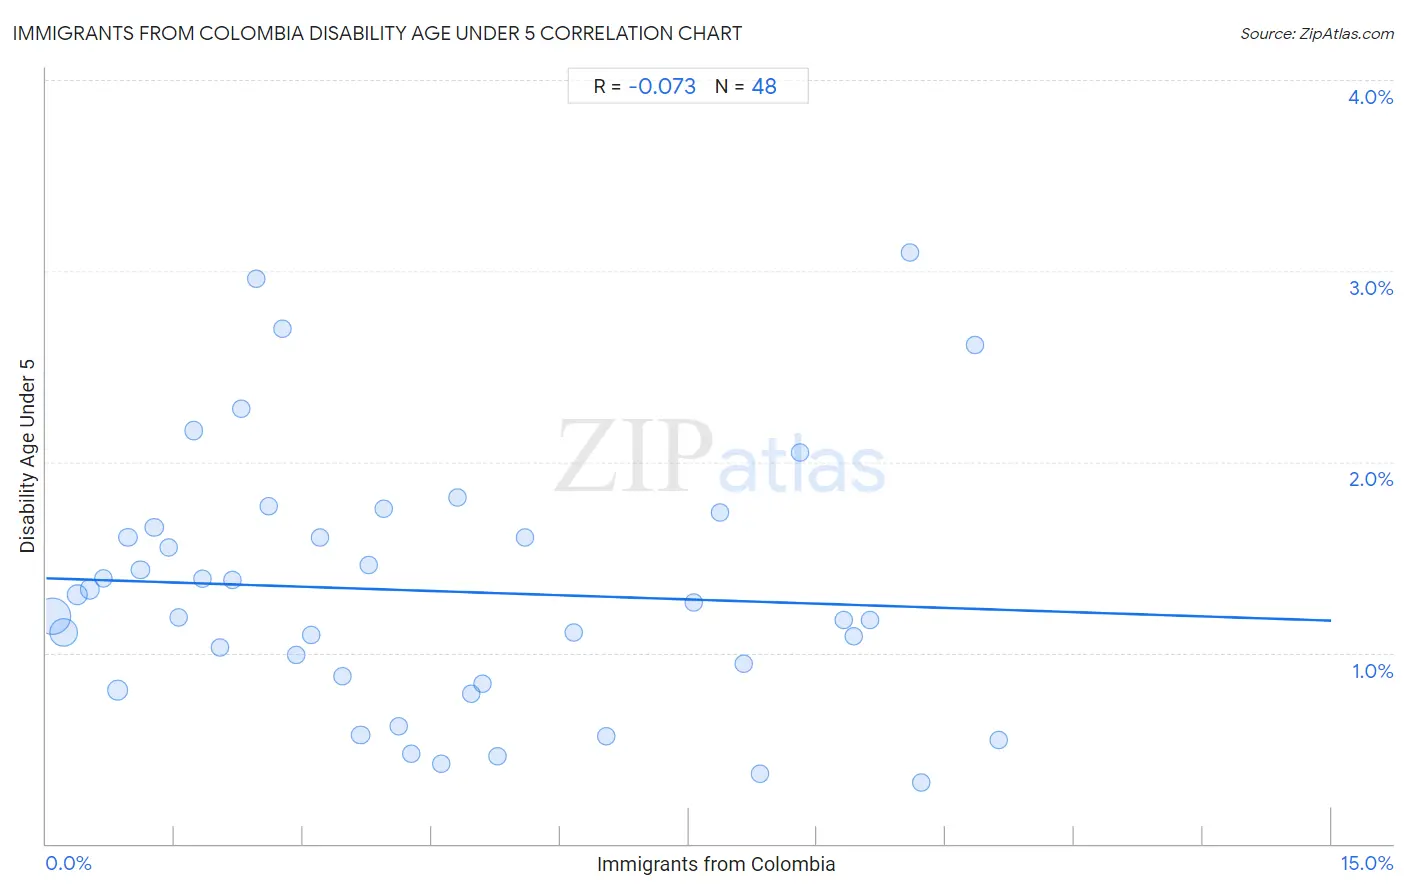
Immigrants from Colombia Disability Age Under 5 Correlation Chart
The statistical analysis conducted on geographies consisting of 209,665,961 people shows a slight negative correlation between the proportion of Immigrants from Colombia and percentage of population with a disability under the age of 5 in the United States with a correlation coefficient (R) of -0.073 and weighted average of 1.2%. On average, for every 1% (one percent) increase in Immigrants from Colombia within a typical geography, there is a decrease of 0.015% in percentage of population with a disability under the age of 5.
It is essential to understand that the correlation between the percentage of Immigrants from Colombia and percentage of population with a disability under the age of 5 does not imply a direct cause-and-effect relationship. It remains uncertain whether the presence of Immigrants from Colombia influences an upward or downward trend in the level of percentage of population with a disability under the age of 5 within an area, or if Immigrants from Colombia simply ended up residing in those areas with higher or lower levels of percentage of population with a disability under the age of 5 due to other factors.
Demographics Similar to Immigrants from Colombia by Disability Age Under 5
In terms of disability age under 5, the demographic groups most similar to Immigrants from Colombia are Alsatian (1.2%, a difference of 0.010%), Immigrants from Middle Africa (1.2%, a difference of 0.010%), Immigrants from Honduras (1.2%, a difference of 0.15%), Immigrants from Zimbabwe (1.2%, a difference of 0.19%), and Somali (1.2%, a difference of 0.21%).
| Demographics | Rating | Rank | Disability Age Under 5 |
| Fijians | 84.7 /100 | #135 | Excellent 1.2% |
| Moroccans | 83.6 /100 | #136 | Excellent 1.2% |
| Immigrants from Eastern Africa | 83.1 /100 | #137 | Excellent 1.2% |
| Immigrants from Czechoslovakia | 82.8 /100 | #138 | Excellent 1.2% |
| New Zealanders | 81.4 /100 | #139 | Excellent 1.2% |
| Somalis | 80.8 /100 | #140 | Excellent 1.2% |
| Immigrants from Honduras | 80.4 /100 | #141 | Excellent 1.2% |
| Immigrants from Colombia | 79.3 /100 | #142 | Good 1.2% |
| Alsatians | 79.3 /100 | #143 | Good 1.2% |
| Immigrants from Middle Africa | 79.3 /100 | #144 | Good 1.2% |
| Immigrants from Zimbabwe | 77.9 /100 | #145 | Good 1.2% |
| Samoans | 77.7 /100 | #146 | Good 1.2% |
| Icelanders | 76.3 /100 | #147 | Good 1.2% |
| Ghanaians | 76.3 /100 | #148 | Good 1.2% |
| Kenyans | 75.9 /100 | #149 | Good 1.2% |
Immigrants from Colombia Disability Age Under 5 Correlation Summary
| Measurement | Immigrants from Colombia Data | Disability Age Under 5 Data |
| Minimum | 0.068% | 0.32% |
| Maximum | 11.1% | 3.1% |
| Range | 11.0% | 2.8% |
| Mean | 4.4% | 1.3% |
| Median | 3.7% | 1.2% |
| Interquartile 25% (IQ1) | 1.8% | 0.86% |
| Interquartile 75% (IQ3) | 7.0% | 1.6% |
| Interquartile Range (IQR) | 5.3% | 0.78% |
| Standard Deviation (Sample) | 3.3% | 0.67% |
| Standard Deviation (Population) | 3.2% | 0.66% |
Correlation Details
| Immigrants from Colombia Percentile | Sample Size | Disability Age Under 5 |
[ 0.0% - 0.5% ] 0.068% | 101,652,490 | 1.2% |
[ 0.0% - 0.5% ] 0.21% | 55,137,440 | 1.1% |
[ 0.0% - 0.5% ] 0.37% | 15,744,610 | 1.3% |
[ 0.5% - 1.0% ] 0.50% | 8,681,073 | 1.3% |
[ 0.5% - 1.0% ] 0.67% | 3,878,717 | 1.4% |
[ 0.5% - 1.0% ] 0.83% | 11,877,646 | 0.80% |
[ 0.5% - 1.0% ] 0.95% | 1,705,374 | 1.6% |
[ 1.0% - 1.5% ] 1.10% | 2,109,896 | 1.4% |
[ 1.0% - 1.5% ] 1.26% | 1,302,557 | 1.7% |
[ 1.0% - 1.5% ] 1.43% | 721,785 | 1.5% |
[ 1.5% - 2.0% ] 1.55% | 955,432 | 1.2% |
[ 1.5% - 2.0% ] 1.72% | 378,146 | 2.2% |
[ 1.5% - 2.0% ] 1.83% | 591,300 | 1.4% |
[ 2.0% - 2.5% ] 2.03% | 290,049 | 1.0% |
[ 2.0% - 2.5% ] 2.17% | 630,123 | 1.4% |
[ 2.0% - 2.5% ] 2.28% | 120,868 | 2.3% |
[ 2.0% - 2.5% ] 2.46% | 193,412 | 3.0% |
[ 2.5% - 3.0% ] 2.60% | 142,841 | 1.8% |
[ 2.5% - 3.0% ] 2.76% | 219,702 | 2.7% |
[ 2.5% - 3.0% ] 2.92% | 380,971 | 0.99% |
[ 3.0% - 3.5% ] 3.10% | 629,739 | 1.1% |
[ 3.0% - 3.5% ] 3.20% | 53,266 | 1.6% |
[ 3.0% - 3.5% ] 3.45% | 343,677 | 0.88% |
[ 3.5% - 4.0% ] 3.67% | 197,409 | 0.57% |
[ 3.5% - 4.0% ] 3.76% | 165,500 | 1.5% |
[ 3.5% - 4.0% ] 3.93% | 257,278 | 1.8% |
[ 4.0% - 4.5% ] 4.12% | 96,748 | 0.61% |
[ 4.0% - 4.5% ] 4.27% | 56,791 | 0.47% |
[ 4.5% - 5.0% ] 4.61% | 41,661 | 0.42% |
[ 4.5% - 5.0% ] 4.80% | 34,335 | 1.8% |
[ 4.5% - 5.0% ] 4.95% | 115,905 | 0.78% |
[ 5.0% - 5.5% ] 5.09% | 255,382 | 0.84% |
[ 5.0% - 5.5% ] 5.26% | 48,762 | 0.46% |
[ 5.5% - 6.0% ] 5.59% | 25,283 | 1.6% |
[ 6.0% - 6.5% ] 6.16% | 109,673 | 1.1% |
[ 6.5% - 7.0% ] 6.54% | 29,530 | 0.56% |
[ 7.5% - 8.0% ] 7.56% | 57,066 | 1.3% |
[ 7.5% - 8.0% ] 7.86% | 19,625 | 1.7% |
[ 8.0% - 8.5% ] 8.14% | 56,484 | 0.94% |
[ 8.0% - 8.5% ] 8.34% | 121,169 | 0.37% |
[ 8.5% - 9.0% ] 8.80% | 67,001 | 2.0% |
[ 9.0% - 9.5% ] 9.31% | 17,517 | 1.2% |
[ 9.0% - 9.5% ] 9.42% | 42,207 | 1.1% |
[ 9.5% - 10.0% ] 9.62% | 16,939 | 1.2% |
[ 10.0% - 10.5% ] 10.08% | 2,251 | 3.1% |
[ 10.0% - 10.5% ] 10.21% | 26,548 | 0.32% |
[ 10.5% - 11.0% ] 10.84% | 45,357 | 2.6% |
[ 11.0% - 11.5% ] 11.11% | 18,426 | 0.54% |