Ukrainian vs Immigrants from Bahamas 4 or more Vehicles in Household

COMPARE

Ukrainian
Race
Ancestry
AfghanAfricanAlaska NativeAlaskan AthabascanAlbanianAleutAlsatianAmericanApacheArabArapahoArgentineanArmenianAssyrian/Chaldean/SyriacAustralianAustrianBahamianBangladeshiBarbadianBasqueBelgianBelizeanBermudanBhutaneseBlackfeetBolivianBrazilianBritishBritish West IndianBulgarianBurmeseCajunCambodianCanadianCape VerdeanCarpatho RusynCelticCentral AmericanCentral American IndianCherokeeCheyenneChickasawChileanChineseChippewaChoctawColombianColvilleComancheCosta RicanCreeCreekCroatianCrowCubanCypriotCzechCzechoslovakianDanishDelawareDominicanDutchDutch West IndianEastern EuropeanEcuadorianEgyptianEnglishEstonianEthiopianEuropeanFijianFilipinoFinnishFrenchFrench American IndianFrench CanadianGermanGerman RussianGhanaianGreekGuamanian/ChamorroGuatemalanGuyaneseHaitianHmongHonduranHopiHoumaHungarianIcelanderIndian (Asian)IndonesianInupiatIranianIraqiIrishIroquoisIsraeliItalianJamaicanJapaneseJordanianKenyanKiowaKoreanLaotianLatvianLebaneseLiberianLithuanianLumbeeLuxembourgerMacedonianMalaysianMalteseMarshalleseMenomineeMexicanMexican American IndianMongolianMoroccanNative HawaiianNavajoNepaleseNew ZealanderNicaraguanNigerianNorthern EuropeanNorwegianOkinawanOsageOttawaPaiutePakistaniPalestinianPanamanianParaguayanPennsylvania GermanPeruvianPimaPolishPortuguesePotawatomiPuebloPuerto RicanPuget Sound SalishRomanianRussianSalvadoranSamoanScandinavianScotch-IrishScottishSeminoleSenegaleseSerbianShoshoneSierra LeoneanSiouxSlavicSlovakSloveneSomaliSouth AfricanSouth AmericanSouth American IndianSoviet UnionSpaniardSpanishSpanish AmericanSpanish American IndianSri LankanSubsaharan AfricanSudaneseSwedishSwissSyrianTaiwaneseThaiTlingit-HaidaTohono O'OdhamTonganTrinidadian and TobagonianTsimshianTurkishU.S. Virgin IslanderUgandanUkrainianUruguayanUteVenezuelanVietnameseWelshWest IndianYakamaYaquiYugoslavianYumanYup'ikZimbabwean
Immigration
NonimmigrantsImmigrantsAfghanistanAfricaAlbaniaArgentinaArmeniaAsiaAustraliaAustriaBangladeshBarbadosBelarusBelgiumBelizeBoliviaBosnia and HerzegovinaBrazilBulgariaBurma/MyanmarCabo VerdeCambodiaCameroonCanadaCaribbeanCentral AmericaChileChinaColombiaCongoCosta RicaCroatiaCubaCzechoslovakiaDenmarkDominicaDominican RepublicEastern AfricaEastern AsiaEastern EuropeEcuadorEgyptEl SalvadorEnglandEritreaEthiopiaEuropeFijiFranceGermanyGhanaGreeceGrenadaGuatemalaGuyanaHaitiHondurasHong KongHungaryIndiaIndonesiaIranIraqIrelandIsraelItalyJamaicaJapanJordanKazakhstanKenyaKoreaKuwaitLaosLatin AmericaLatviaLebanonLiberiaLithuaniaMalaysiaMexicoMicronesiaMiddle AfricaMoldovaMoroccoNepalNetherlandsNicaraguaNigeriaNorth AmericaNorth MacedoniaNorthern AfricaNorthern EuropeNorwayOceaniaPakistanPanamaPeruPhilippinesPolandPortugalRomaniaRussiaSaudi ArabiaScotlandSenegalSerbiaSierra LeoneSingaporeSomaliaSouth AfricaSouth AmericaSouth Central AsiaSouth Eastern AsiaSouthern EuropeSpainSri LankaSt. Vincent and the GrenadinesSudanSwedenSwitzerlandSyriaTaiwanThailandTrinidad and TobagoTurkeyUgandaUkraineUruguayUzbekistanVenezuelaVietnamWest IndiesWestern AfricaWestern AsiaWestern EuropeYemenZaireZimbabweAzores
Immigrants from Bahamas
Race
Ancestry
AfghanAfricanAlaska NativeAlaskan AthabascanAlbanianAleutAlsatianAmericanApacheArabArapahoArgentineanArmenianAssyrian/Chaldean/SyriacAustralianAustrianBahamianBangladeshiBarbadianBasqueBelgianBelizeanBermudanBhutaneseBlackfeetBolivianBrazilianBritishBritish West IndianBulgarianBurmeseCajunCambodianCanadianCape VerdeanCarpatho RusynCelticCentral AmericanCentral American IndianCherokeeCheyenneChickasawChileanChineseChippewaChoctawColombianColvilleComancheCosta RicanCreeCreekCroatianCrowCubanCypriotCzechCzechoslovakianDanishDelawareDominicanDutchDutch West IndianEastern EuropeanEcuadorianEgyptianEnglishEstonianEthiopianEuropeanFijianFilipinoFinnishFrenchFrench American IndianFrench CanadianGermanGerman RussianGhanaianGreekGuamanian/ChamorroGuatemalanGuyaneseHaitianHmongHonduranHopiHoumaHungarianIcelanderIndian (Asian)IndonesianInupiatIranianIraqiIrishIroquoisIsraeliItalianJamaicanJapaneseJordanianKenyanKiowaKoreanLaotianLatvianLebaneseLiberianLithuanianLumbeeLuxembourgerMacedonianMalaysianMalteseMarshalleseMenomineeMexicanMexican American IndianMongolianMoroccanNative HawaiianNavajoNepaleseNew ZealanderNicaraguanNigerianNorthern EuropeanNorwegianOkinawanOsageOttawaPaiutePakistaniPalestinianPanamanianParaguayanPennsylvania GermanPeruvianPimaPolishPortuguesePotawatomiPuebloPuerto RicanPuget Sound SalishRomanianRussianSalvadoranSamoanScandinavianScotch-IrishScottishSeminoleSenegaleseSerbianShoshoneSierra LeoneanSiouxSlavicSlovakSloveneSomaliSouth AfricanSouth AmericanSouth American IndianSoviet UnionSpaniardSpanishSpanish AmericanSpanish American IndianSri LankanSubsaharan AfricanSudaneseSwedishSwissSyrianTaiwaneseThaiTlingit-HaidaTohono O'OdhamTonganTrinidadian and TobagonianTsimshianTurkishU.S. Virgin IslanderUgandanUruguayanUteVenezuelanVietnameseWelshWest IndianYakamaYaquiYugoslavianYumanYup'ikZimbabwean
Immigration
NonimmigrantsImmigrantsAfghanistanAfricaAlbaniaArgentinaArmeniaAsiaAustraliaAustriaBahamasBangladeshBarbadosBelarusBelgiumBelizeBoliviaBosnia and HerzegovinaBrazilBulgariaBurma/MyanmarCabo VerdeCambodiaCameroonCanadaCaribbeanCentral AmericaChileChinaColombiaCongoCosta RicaCroatiaCubaCzechoslovakiaDenmarkDominicaDominican RepublicEastern AfricaEastern AsiaEastern EuropeEcuadorEgyptEl SalvadorEnglandEritreaEthiopiaEuropeFijiFranceGermanyGhanaGreeceGrenadaGuatemalaGuyanaHaitiHondurasHong KongHungaryIndiaIndonesiaIranIraqIrelandIsraelItalyJamaicaJapanJordanKazakhstanKenyaKoreaKuwaitLaosLatin AmericaLatviaLebanonLiberiaLithuaniaMalaysiaMexicoMicronesiaMiddle AfricaMoldovaMoroccoNepalNetherlandsNicaraguaNigeriaNorth AmericaNorth MacedoniaNorthern AfricaNorthern EuropeNorwayOceaniaPakistanPanamaPeruPhilippinesPolandPortugalRomaniaRussiaSaudi ArabiaScotlandSenegalSerbiaSierra LeoneSingaporeSomaliaSouth AfricaSouth AmericaSouth Central AsiaSouth Eastern AsiaSouthern EuropeSpainSri LankaSt. Vincent and the GrenadinesSudanSwedenSwitzerlandSyriaTaiwanThailandTrinidad and TobagoTurkeyUgandaUkraineUruguayUzbekistanVenezuelaVietnamWest IndiesWestern AfricaWestern AsiaWestern EuropeYemenZaireZimbabweAzores
4 or more Vehicles in Household
Income
Poverty
Unemployment
Labor Participation
Family Structure
Vehicle Availability
Education Level
Disability

4 or more Vehicles in Household Comparison

Ukrainians

Immigrants from Bahamas

Average
Tragic
6.3%
4 OR MORE VEHICLES IN HOUSEHOLD
47.6/ 100
METRIC RATING
176th/ 347
METRIC RANK
5.3%
4 OR MORE VEHICLES IN HOUSEHOLD
0.1/ 100
METRIC RATING
291st/ 347
METRIC RANK

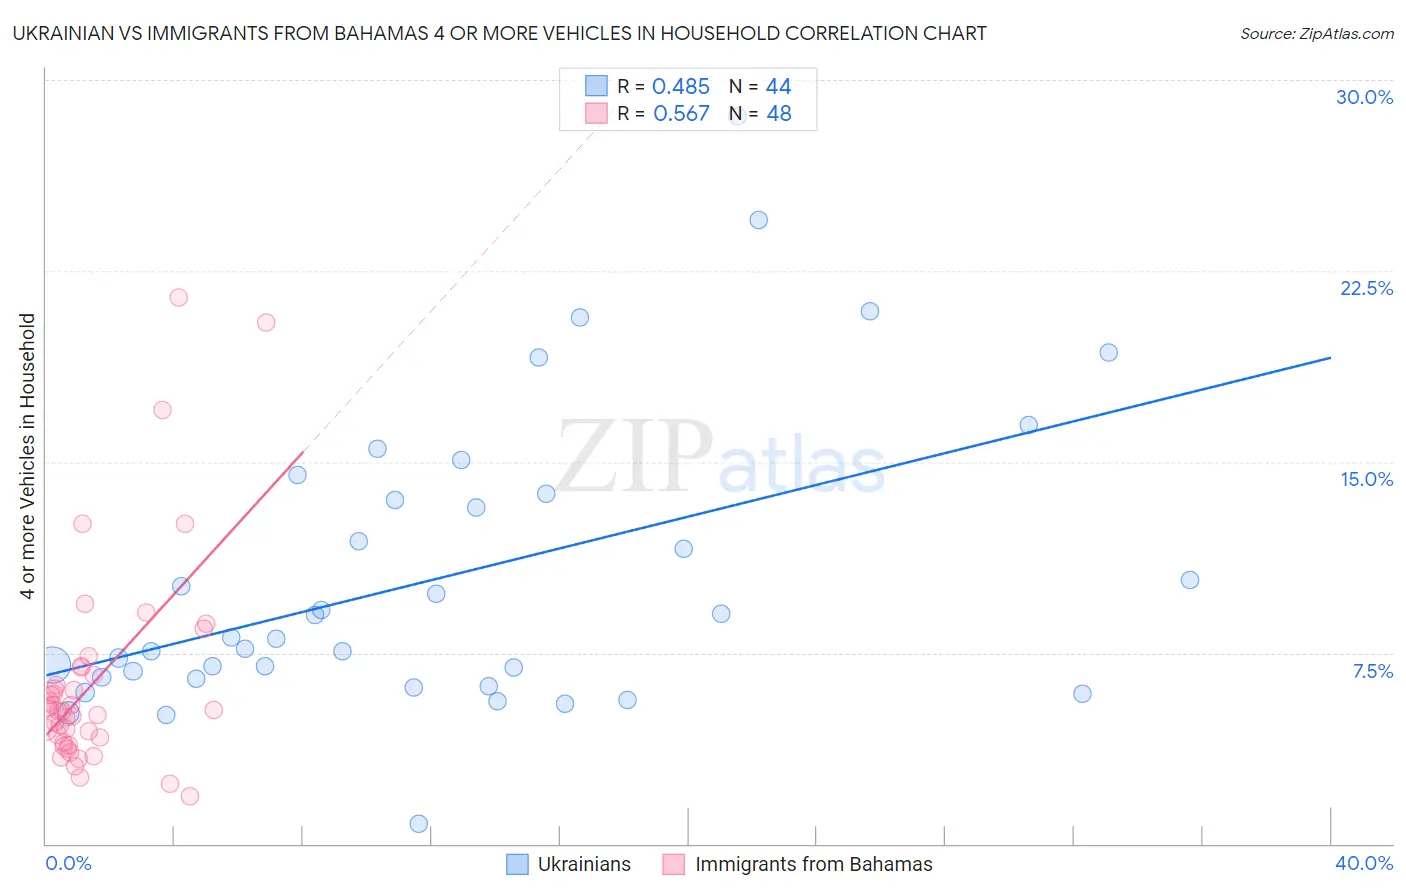
Ukrainian vs Immigrants from Bahamas 4 or more Vehicles in Household Correlation Chart

The statistical analysis conducted on geographies consisting of 446,444,897 people shows a moderate positive correlation between the proportion of Ukrainians and percentage of households with 4 or more vehicles available in the United States with a correlation coefficient (R) of 0.485 and weighted average of 6.3%. Similarly, the statistical analysis conducted on geographies consisting of 104,355,564 people shows a substantial positive correlation between the proportion of Immigrants from Bahamas and percentage of households with 4 or more vehicles available in the United States with a correlation coefficient (R) of 0.567 and weighted average of 5.3%, a difference of 20.1%.
Ukrainian vs Immigrants from Bahamas 4 or more Vehicles in Household

4 or more Vehicles in Household Correlation Summary

MeasurementUkrainianImmigrants from Bahamas
Minimum0.81%1.9%
Maximum28.6%21.5%
Range27.8%19.6%
Mean10.5%6.4%
Median8.1%5.3%
Interquartile 25% (IQ1)6.5%4.1%
Interquartile 75% (IQ3)13.6%6.8%
Interquartile Range (IQR)7.1%2.7%
Standard Deviation (Sample)5.8%4.1%
Standard Deviation (Population)5.8%4.1%

Similar Demographics by 4 or more Vehicles in Household

Demographics Similar to Ukrainians by 4 or more Vehicles in Household

In terms of 4 or more vehicles in household, the demographic groups most similar to Ukrainians are Slovak (6.3%, a difference of 0.070%), Immigrants from Western Europe (6.3%, a difference of 0.12%), Lithuanian (6.3%, a difference of 0.24%), Belizean (6.3%, a difference of 0.31%), and Slovene (6.3%, a difference of 0.36%).
DemographicsRating | Rank4 or more Vehicles in Household
Estonians
55.1
/100
|
#169
Average
6.4%
Immigrants | Syria
52.8
/100
|
#170
Average
6.3%
Immigrants | India
51.9
/100
|
#171
Average
6.3%
Immigrants | Lebanon
51.7
/100
|
#172
Average
6.3%
Slovenes
51.1
/100
|
#173
Average
6.3%
Lithuanians
50.0
/100
|
#174
Average
6.3%
Immigrants | Western Europe
48.8
/100
|
#175
Average
6.3%
Ukrainians
47.6
/100
|
#176
Average
6.3%
Slovaks
46.9
/100
|
#177
Average
6.3%
Belizeans
44.5
/100
|
#178
Average
6.3%
Immigrants | Japan
43.1
/100
|
#179
Average
6.3%
Syrians
42.0
/100
|
#180
Average
6.3%
Yugoslavians
41.1
/100
|
#181
Average
6.3%
South American Indians
40.7
/100
|
#182
Average
6.3%
Immigrants | Burma/Myanmar
37.5
/100
|
#183
Fair
6.2%

Demographics Similar to Immigrants from Bahamas by 4 or more Vehicles in Household

In terms of 4 or more vehicles in household, the demographic groups most similar to Immigrants from Bahamas are Liberian (5.3%, a difference of 0.10%), Immigrants from Congo (5.2%, a difference of 0.13%), Ghanaian (5.2%, a difference of 0.19%), Immigrants from Brazil (5.2%, a difference of 0.30%), and Israeli (5.2%, a difference of 0.48%).
DemographicsRating | Rank4 or more Vehicles in Household
Brazilians
0.3
/100
|
#284
Tragic
5.4%
Immigrants | Liberia
0.2
/100
|
#285
Tragic
5.4%
Immigrants | Colombia
0.2
/100
|
#286
Tragic
5.4%
Immigrants | Croatia
0.2
/100
|
#287
Tragic
5.4%
Venezuelans
0.2
/100
|
#288
Tragic
5.3%
Immigrants | Bosnia and Herzegovina
0.2
/100
|
#289
Tragic
5.3%
Immigrants | Russia
0.2
/100
|
#290
Tragic
5.3%
Immigrants | Bahamas
0.1
/100
|
#291
Tragic
5.3%
Liberians
0.1
/100
|
#292
Tragic
5.3%
Immigrants | Congo
0.1
/100
|
#293
Tragic
5.2%
Ghanaians
0.1
/100
|
#294
Tragic
5.2%
Immigrants | Brazil
0.1
/100
|
#295
Tragic
5.2%
Israelis
0.1
/100
|
#296
Tragic
5.2%
Immigrants | Venezuela
0.1
/100
|
#297
Tragic
5.2%
Immigrants | South America
0.1
/100
|
#298
Tragic
5.2%