Portuguese vs Immigrants from Bosnia and Herzegovina 4 or more Vehicles in Household

COMPARE

Portuguese
Race
Ancestry
AfghanAfricanAlaska NativeAlaskan AthabascanAlbanianAleutAlsatianAmericanApacheArabArapahoArgentineanArmenianAssyrian/Chaldean/SyriacAustralianAustrianBahamianBangladeshiBarbadianBasqueBelgianBelizeanBermudanBhutaneseBlackfeetBolivianBrazilianBritishBritish West IndianBulgarianBurmeseCajunCambodianCanadianCape VerdeanCarpatho RusynCelticCentral AmericanCentral American IndianCherokeeCheyenneChickasawChileanChineseChippewaChoctawColombianColvilleComancheCosta RicanCreeCreekCroatianCrowCubanCypriotCzechCzechoslovakianDanishDelawareDominicanDutchDutch West IndianEastern EuropeanEcuadorianEgyptianEnglishEstonianEthiopianEuropeanFijianFilipinoFinnishFrenchFrench American IndianFrench CanadianGermanGerman RussianGhanaianGreekGuamanian/ChamorroGuatemalanGuyaneseHaitianHmongHonduranHopiHoumaHungarianIcelanderIndian (Asian)IndonesianInupiatIranianIraqiIrishIroquoisIsraeliItalianJamaicanJapaneseJordanianKenyanKiowaKoreanLaotianLatvianLebaneseLiberianLithuanianLumbeeLuxembourgerMacedonianMalaysianMalteseMarshalleseMenomineeMexicanMexican American IndianMongolianMoroccanNative HawaiianNavajoNepaleseNew ZealanderNicaraguanNigerianNorthern EuropeanNorwegianOkinawanOsageOttawaPaiutePakistaniPalestinianPanamanianParaguayanPennsylvania GermanPeruvianPimaPolishPortuguesePotawatomiPuebloPuerto RicanPuget Sound SalishRomanianRussianSalvadoranSamoanScandinavianScotch-IrishScottishSeminoleSenegaleseSerbianShoshoneSierra LeoneanSiouxSlavicSlovakSloveneSomaliSouth AfricanSouth AmericanSouth American IndianSoviet UnionSpaniardSpanishSpanish AmericanSpanish American IndianSri LankanSubsaharan AfricanSudaneseSwedishSwissSyrianTaiwaneseThaiTlingit-HaidaTohono O'OdhamTonganTrinidadian and TobagonianTsimshianTurkishU.S. Virgin IslanderUgandanUkrainianUruguayanUteVenezuelanVietnameseWelshWest IndianYakamaYaquiYugoslavianYumanYup'ikZimbabwean
Immigration
NonimmigrantsImmigrantsAfghanistanAfricaAlbaniaArgentinaArmeniaAsiaAustraliaAustriaBahamasBangladeshBarbadosBelarusBelgiumBelizeBoliviaBrazilBulgariaBurma/MyanmarCabo VerdeCambodiaCameroonCanadaCaribbeanCentral AmericaChileChinaColombiaCongoCosta RicaCroatiaCubaCzechoslovakiaDenmarkDominicaDominican RepublicEastern AfricaEastern AsiaEastern EuropeEcuadorEgyptEl SalvadorEnglandEritreaEthiopiaEuropeFijiFranceGermanyGhanaGreeceGrenadaGuatemalaGuyanaHaitiHondurasHong KongHungaryIndiaIndonesiaIranIraqIrelandIsraelItalyJamaicaJapanJordanKazakhstanKenyaKoreaKuwaitLaosLatin AmericaLatviaLebanonLiberiaLithuaniaMalaysiaMexicoMicronesiaMiddle AfricaMoldovaMoroccoNepalNetherlandsNicaraguaNigeriaNorth AmericaNorth MacedoniaNorthern AfricaNorthern EuropeNorwayOceaniaPakistanPanamaPeruPhilippinesPolandPortugalRomaniaRussiaSaudi ArabiaScotlandSenegalSerbiaSierra LeoneSingaporeSomaliaSouth AfricaSouth AmericaSouth Central AsiaSouth Eastern AsiaSouthern EuropeSpainSri LankaSt. Vincent and the GrenadinesSudanSwedenSwitzerlandSyriaTaiwanThailandTrinidad and TobagoTurkeyUgandaUkraineUruguayUzbekistanVenezuelaVietnamWest IndiesWestern AfricaWestern AsiaWestern EuropeYemenZaireZimbabweAzores
Immigrants from Bosnia and Herzegovina
Race
Ancestry
AfghanAfricanAlaska NativeAlaskan AthabascanAlbanianAleutAlsatianAmericanApacheArabArapahoArgentineanArmenianAssyrian/Chaldean/SyriacAustralianAustrianBahamianBangladeshiBarbadianBasqueBelgianBelizeanBermudanBhutaneseBlackfeetBolivianBrazilianBritishBritish West IndianBulgarianBurmeseCajunCambodianCanadianCape VerdeanCarpatho RusynCelticCentral AmericanCentral American IndianCherokeeCheyenneChickasawChileanChineseChippewaChoctawColombianColvilleComancheCosta RicanCreeCreekCroatianCrowCubanCypriotCzechCzechoslovakianDanishDelawareDominicanDutchDutch West IndianEastern EuropeanEcuadorianEgyptianEnglishEstonianEthiopianEuropeanFijianFilipinoFinnishFrenchFrench American IndianFrench CanadianGermanGerman RussianGhanaianGreekGuamanian/ChamorroGuatemalanGuyaneseHaitianHmongHonduranHopiHoumaHungarianIcelanderIndian (Asian)IndonesianInupiatIranianIraqiIrishIroquoisIsraeliItalianJamaicanJapaneseJordanianKenyanKiowaKoreanLaotianLatvianLebaneseLiberianLithuanianLumbeeLuxembourgerMacedonianMalaysianMalteseMarshalleseMenomineeMexicanMexican American IndianMongolianMoroccanNative HawaiianNavajoNepaleseNew ZealanderNicaraguanNigerianNorthern EuropeanNorwegianOkinawanOsageOttawaPaiutePakistaniPalestinianPanamanianParaguayanPennsylvania GermanPeruvianPimaPolishPotawatomiPuebloPuerto RicanPuget Sound SalishRomanianRussianSalvadoranSamoanScandinavianScotch-IrishScottishSeminoleSenegaleseSerbianShoshoneSierra LeoneanSiouxSlavicSlovakSloveneSomaliSouth AfricanSouth AmericanSouth American IndianSoviet UnionSpaniardSpanishSpanish AmericanSpanish American IndianSri LankanSubsaharan AfricanSudaneseSwedishSwissSyrianTaiwaneseThaiTlingit-HaidaTohono O'OdhamTonganTrinidadian and TobagonianTsimshianTurkishU.S. Virgin IslanderUgandanUkrainianUruguayanUteVenezuelanVietnameseWelshWest IndianYakamaYaquiYugoslavianYumanYup'ikZimbabwean
Immigration
NonimmigrantsImmigrantsAfghanistanAfricaAlbaniaArgentinaArmeniaAsiaAustraliaAustriaBahamasBangladeshBarbadosBelarusBelgiumBelizeBoliviaBosnia and HerzegovinaBrazilBulgariaBurma/MyanmarCabo VerdeCambodiaCameroonCanadaCaribbeanCentral AmericaChileChinaColombiaCongoCosta RicaCroatiaCubaCzechoslovakiaDenmarkDominicaDominican RepublicEastern AfricaEastern AsiaEastern EuropeEcuadorEgyptEl SalvadorEnglandEritreaEthiopiaEuropeFijiFranceGermanyGhanaGreeceGrenadaGuatemalaGuyanaHaitiHondurasHong KongHungaryIndiaIndonesiaIranIraqIrelandIsraelItalyJamaicaJapanJordanKazakhstanKenyaKoreaKuwaitLaosLatin AmericaLatviaLebanonLiberiaLithuaniaMalaysiaMexicoMicronesiaMiddle AfricaMoldovaMoroccoNepalNetherlandsNicaraguaNigeriaNorth AmericaNorth MacedoniaNorthern AfricaNorthern EuropeNorwayOceaniaPakistanPanamaPeruPhilippinesPolandPortugalRomaniaRussiaSaudi ArabiaScotlandSenegalSerbiaSierra LeoneSingaporeSomaliaSouth AfricaSouth AmericaSouth Central AsiaSouth Eastern AsiaSouthern EuropeSpainSri LankaSt. Vincent and the GrenadinesSudanSwedenSwitzerlandSyriaTaiwanThailandTrinidad and TobagoTurkeyUgandaUkraineUruguayUzbekistanVenezuelaVietnamWest IndiesWestern AfricaWestern AsiaWestern EuropeYemenZaireZimbabweAzores
4 or more Vehicles in Household
Income
Poverty
Unemployment
Labor Participation
Family Structure
Vehicle Availability
Education Level
Disability

4 or more Vehicles in Household Comparison

Portuguese

Immigrants from Bosnia and Herzegovina

Exceptional
Tragic
7.4%
4 OR MORE VEHICLES IN HOUSEHOLD
99.9/ 100
METRIC RATING
73rd/ 347
METRIC RANK
5.3%
4 OR MORE VEHICLES IN HOUSEHOLD
0.2/ 100
METRIC RATING
289th/ 347
METRIC RANK

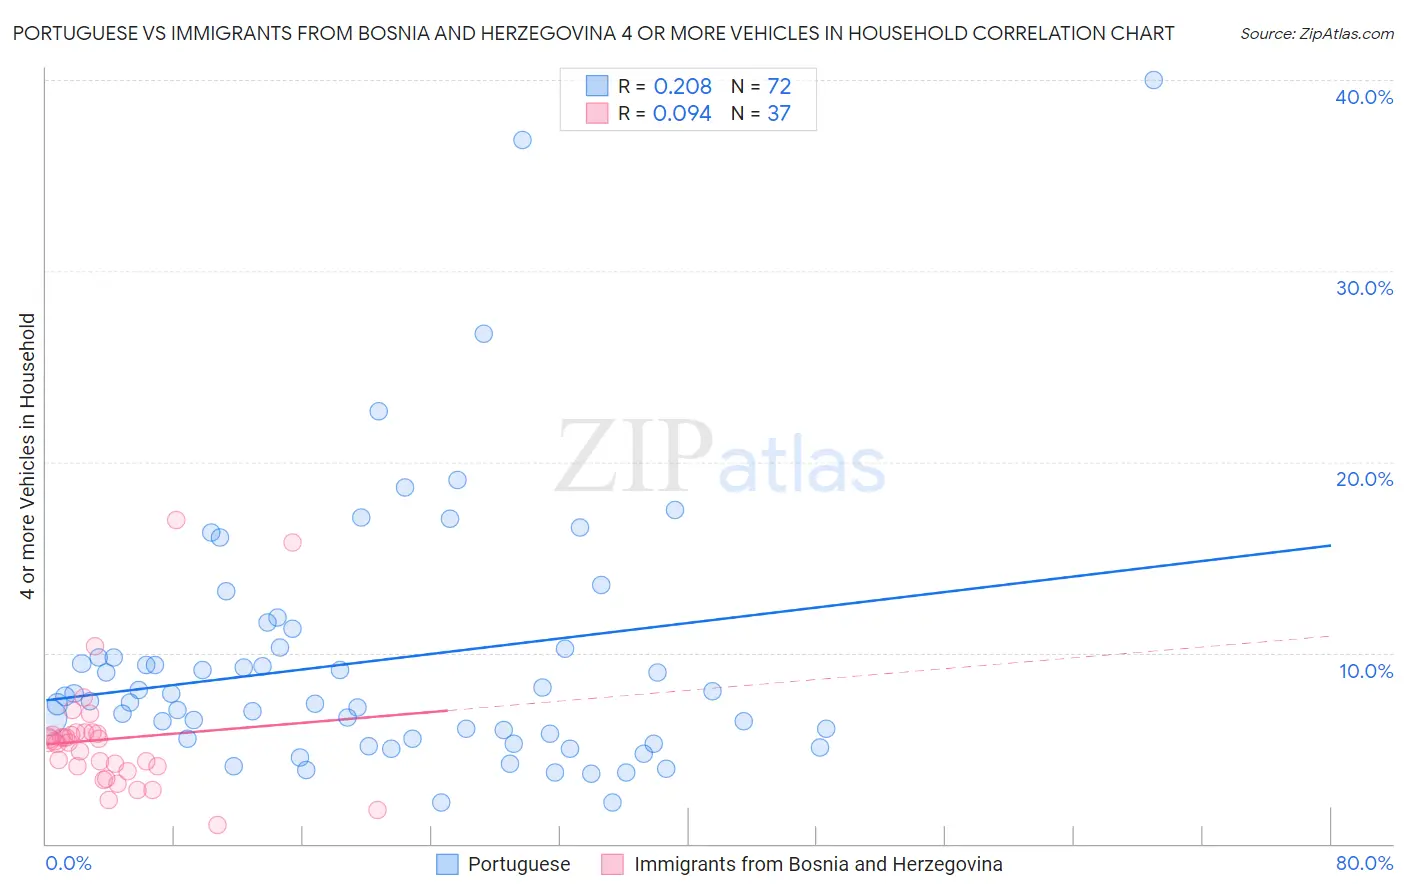
Portuguese vs Immigrants from Bosnia and Herzegovina 4 or more Vehicles in Household Correlation Chart

The statistical analysis conducted on geographies consisting of 448,080,831 people shows a weak positive correlation between the proportion of Portuguese and percentage of households with 4 or more vehicles available in the United States with a correlation coefficient (R) of 0.208 and weighted average of 7.4%. Similarly, the statistical analysis conducted on geographies consisting of 156,484,341 people shows a slight positive correlation between the proportion of Immigrants from Bosnia and Herzegovina and percentage of households with 4 or more vehicles available in the United States with a correlation coefficient (R) of 0.094 and weighted average of 5.3%, a difference of 38.9%.
Portuguese vs Immigrants from Bosnia and Herzegovina 4 or more Vehicles in Household

4 or more Vehicles in Household Correlation Summary

MeasurementPortugueseImmigrants from Bosnia and Herzegovina
Minimum2.1%0.96%
Maximum40.0%17.0%
Range37.9%16.0%
Mean9.6%5.5%
Median7.6%5.4%
Interquartile 25% (IQ1)5.5%3.9%
Interquartile 75% (IQ3)10.2%5.8%
Interquartile Range (IQR)4.8%1.9%
Standard Deviation (Sample)6.9%3.2%
Standard Deviation (Population)6.8%3.1%

Similar Demographics by 4 or more Vehicles in Household

Demographics Similar to Portuguese by 4 or more Vehicles in Household

In terms of 4 or more vehicles in household, the demographic groups most similar to Portuguese are Scotch-Irish (7.4%, a difference of 0.090%), Icelander (7.4%, a difference of 0.30%), Immigrants from Cambodia (7.4%, a difference of 0.31%), Laotian (7.4%, a difference of 0.36%), and Chickasaw (7.4%, a difference of 0.39%).
DemographicsRating | Rank4 or more Vehicles in Household
Immigrants | Taiwan
99.9
/100
|
#66
Exceptional
7.5%
Americans
99.9
/100
|
#67
Exceptional
7.5%
Welsh
99.9
/100
|
#68
Exceptional
7.5%
Germans
99.9
/100
|
#69
Exceptional
7.5%
Scottish
99.9
/100
|
#70
Exceptional
7.4%
Chickasaw
99.9
/100
|
#71
Exceptional
7.4%
Scotch-Irish
99.9
/100
|
#72
Exceptional
7.4%
Portuguese
99.9
/100
|
#73
Exceptional
7.4%
Icelanders
99.9
/100
|
#74
Exceptional
7.4%
Immigrants | Cambodia
99.9
/100
|
#75
Exceptional
7.4%
Laotians
99.9
/100
|
#76
Exceptional
7.4%
Apache
99.9
/100
|
#77
Exceptional
7.4%
Whites/Caucasians
99.8
/100
|
#78
Exceptional
7.4%
Czechs
99.8
/100
|
#79
Exceptional
7.4%
Alaska Natives
99.8
/100
|
#80
Exceptional
7.3%

Demographics Similar to Immigrants from Bosnia and Herzegovina by 4 or more Vehicles in Household

In terms of 4 or more vehicles in household, the demographic groups most similar to Immigrants from Bosnia and Herzegovina are Venezuelan (5.3%, a difference of 0.14%), Immigrants from Russia (5.3%, a difference of 0.30%), Immigrants from Croatia (5.4%, a difference of 0.33%), Immigrants from Colombia (5.4%, a difference of 0.42%), and Immigrants from Liberia (5.4%, a difference of 0.46%).
DemographicsRating | Rank4 or more Vehicles in Household
Immigrants | Spain
0.3
/100
|
#282
Tragic
5.4%
Immigrants | Ireland
0.3
/100
|
#283
Tragic
5.4%
Brazilians
0.3
/100
|
#284
Tragic
5.4%
Immigrants | Liberia
0.2
/100
|
#285
Tragic
5.4%
Immigrants | Colombia
0.2
/100
|
#286
Tragic
5.4%
Immigrants | Croatia
0.2
/100
|
#287
Tragic
5.4%
Venezuelans
0.2
/100
|
#288
Tragic
5.3%
Immigrants | Bosnia and Herzegovina
0.2
/100
|
#289
Tragic
5.3%
Immigrants | Russia
0.2
/100
|
#290
Tragic
5.3%
Immigrants | Bahamas
0.1
/100
|
#291
Tragic
5.3%
Liberians
0.1
/100
|
#292
Tragic
5.3%
Immigrants | Congo
0.1
/100
|
#293
Tragic
5.2%
Ghanaians
0.1
/100
|
#294
Tragic
5.2%
Immigrants | Brazil
0.1
/100
|
#295
Tragic
5.2%
Israelis
0.1
/100
|
#296
Tragic
5.2%