Osage vs Immigrants from Afghanistan 4 or more Vehicles in Household

COMPARE

Osage
Race
Ancestry
AfghanAfricanAlaska NativeAlaskan AthabascanAlbanianAleutAlsatianAmericanApacheArabArapahoArgentineanArmenianAssyrian/Chaldean/SyriacAustralianAustrianBahamianBangladeshiBarbadianBasqueBelgianBelizeanBermudanBhutaneseBlackfeetBolivianBrazilianBritishBritish West IndianBulgarianBurmeseCajunCambodianCanadianCape VerdeanCarpatho RusynCelticCentral AmericanCentral American IndianCherokeeCheyenneChickasawChileanChineseChippewaChoctawColombianColvilleComancheCosta RicanCreeCreekCroatianCrowCubanCypriotCzechCzechoslovakianDanishDelawareDominicanDutchDutch West IndianEastern EuropeanEcuadorianEgyptianEnglishEstonianEthiopianEuropeanFijianFilipinoFinnishFrenchFrench American IndianFrench CanadianGermanGerman RussianGhanaianGreekGuamanian/ChamorroGuatemalanGuyaneseHaitianHmongHonduranHopiHoumaHungarianIcelanderIndian (Asian)IndonesianInupiatIranianIraqiIrishIroquoisIsraeliItalianJamaicanJapaneseJordanianKenyanKiowaKoreanLaotianLatvianLebaneseLiberianLithuanianLumbeeLuxembourgerMacedonianMalaysianMalteseMarshalleseMenomineeMexicanMexican American IndianMongolianMoroccanNative HawaiianNavajoNepaleseNew ZealanderNicaraguanNigerianNorthern EuropeanNorwegianOkinawanOsageOttawaPaiutePakistaniPalestinianPanamanianParaguayanPennsylvania GermanPeruvianPimaPolishPortuguesePotawatomiPuebloPuerto RicanPuget Sound SalishRomanianRussianSalvadoranSamoanScandinavianScotch-IrishScottishSeminoleSenegaleseSerbianShoshoneSierra LeoneanSiouxSlavicSlovakSloveneSomaliSouth AfricanSouth AmericanSouth American IndianSoviet UnionSpaniardSpanishSpanish AmericanSpanish American IndianSri LankanSubsaharan AfricanSudaneseSwedishSwissSyrianTaiwaneseThaiTlingit-HaidaTohono O'OdhamTonganTrinidadian and TobagonianTsimshianTurkishU.S. Virgin IslanderUgandanUkrainianUruguayanUteVenezuelanVietnameseWelshWest IndianYakamaYaquiYugoslavianYumanYup'ikZimbabwean
Immigration
NonimmigrantsImmigrantsAfricaAlbaniaArgentinaArmeniaAsiaAustraliaAustriaBahamasBangladeshBarbadosBelarusBelgiumBelizeBoliviaBosnia and HerzegovinaBrazilBulgariaBurma/MyanmarCabo VerdeCambodiaCameroonCanadaCaribbeanCentral AmericaChileChinaColombiaCongoCosta RicaCroatiaCubaCzechoslovakiaDenmarkDominicaDominican RepublicEastern AfricaEastern AsiaEastern EuropeEcuadorEgyptEl SalvadorEnglandEritreaEthiopiaEuropeFijiFranceGermanyGhanaGreeceGrenadaGuatemalaGuyanaHaitiHondurasHong KongHungaryIndiaIndonesiaIranIraqIrelandIsraelItalyJamaicaJapanJordanKazakhstanKenyaKoreaKuwaitLaosLatin AmericaLatviaLebanonLiberiaLithuaniaMalaysiaMexicoMicronesiaMiddle AfricaMoldovaMoroccoNepalNetherlandsNicaraguaNigeriaNorth AmericaNorth MacedoniaNorthern AfricaNorthern EuropeNorwayOceaniaPakistanPanamaPeruPhilippinesPolandPortugalRomaniaRussiaSaudi ArabiaScotlandSenegalSerbiaSierra LeoneSingaporeSomaliaSouth AfricaSouth AmericaSouth Central AsiaSouth Eastern AsiaSouthern EuropeSpainSri LankaSt. Vincent and the GrenadinesSudanSwedenSwitzerlandSyriaTaiwanThailandTrinidad and TobagoTurkeyUgandaUkraineUruguayUzbekistanVenezuelaVietnamWest IndiesWestern AfricaWestern AsiaWestern EuropeYemenZaireZimbabweAzores
Immigrants from Afghanistan
Race
Ancestry
AfghanAfricanAlaska NativeAlaskan AthabascanAlbanianAleutAlsatianAmericanApacheArabArapahoArgentineanArmenianAssyrian/Chaldean/SyriacAustralianAustrianBahamianBangladeshiBarbadianBasqueBelgianBelizeanBermudanBhutaneseBlackfeetBolivianBrazilianBritishBritish West IndianBulgarianBurmeseCajunCambodianCanadianCape VerdeanCarpatho RusynCelticCentral AmericanCentral American IndianCherokeeCheyenneChickasawChileanChineseChippewaChoctawColombianColvilleComancheCosta RicanCreeCreekCroatianCrowCubanCypriotCzechCzechoslovakianDanishDelawareDominicanDutchDutch West IndianEastern EuropeanEcuadorianEgyptianEnglishEstonianEthiopianEuropeanFijianFilipinoFinnishFrenchFrench American IndianFrench CanadianGermanGerman RussianGhanaianGreekGuamanian/ChamorroGuatemalanGuyaneseHaitianHmongHonduranHopiHoumaHungarianIcelanderIndian (Asian)IndonesianInupiatIranianIraqiIrishIroquoisIsraeliItalianJamaicanJapaneseJordanianKenyanKiowaKoreanLaotianLatvianLebaneseLiberianLithuanianLumbeeLuxembourgerMacedonianMalaysianMalteseMarshalleseMenomineeMexicanMexican American IndianMongolianMoroccanNative HawaiianNavajoNepaleseNew ZealanderNicaraguanNigerianNorthern EuropeanNorwegianOkinawanOttawaPaiutePakistaniPalestinianPanamanianParaguayanPennsylvania GermanPeruvianPimaPolishPortuguesePotawatomiPuebloPuerto RicanPuget Sound SalishRomanianRussianSalvadoranSamoanScandinavianScotch-IrishScottishSeminoleSenegaleseSerbianShoshoneSierra LeoneanSiouxSlavicSlovakSloveneSomaliSouth AfricanSouth AmericanSouth American IndianSoviet UnionSpaniardSpanishSpanish AmericanSpanish American IndianSri LankanSubsaharan AfricanSudaneseSwedishSwissSyrianTaiwaneseThaiTlingit-HaidaTohono O'OdhamTonganTrinidadian and TobagonianTsimshianTurkishU.S. Virgin IslanderUgandanUkrainianUruguayanUteVenezuelanVietnameseWelshWest IndianYakamaYaquiYugoslavianYumanYup'ikZimbabwean
Immigration
NonimmigrantsImmigrantsAfghanistanAfricaAlbaniaArgentinaArmeniaAsiaAustraliaAustriaBahamasBangladeshBarbadosBelarusBelgiumBelizeBoliviaBosnia and HerzegovinaBrazilBulgariaBurma/MyanmarCabo VerdeCambodiaCameroonCanadaCaribbeanCentral AmericaChileChinaColombiaCongoCosta RicaCroatiaCubaCzechoslovakiaDenmarkDominicaDominican RepublicEastern AfricaEastern AsiaEastern EuropeEcuadorEgyptEl SalvadorEnglandEritreaEthiopiaEuropeFijiFranceGermanyGhanaGreeceGrenadaGuatemalaGuyanaHaitiHondurasHong KongHungaryIndiaIndonesiaIranIraqIrelandIsraelItalyJamaicaJapanJordanKazakhstanKenyaKoreaKuwaitLaosLatin AmericaLatviaLebanonLiberiaLithuaniaMalaysiaMexicoMicronesiaMiddle AfricaMoldovaMoroccoNepalNetherlandsNicaraguaNigeriaNorth AmericaNorth MacedoniaNorthern AfricaNorthern EuropeNorwayOceaniaPakistanPanamaPeruPhilippinesPolandPortugalRomaniaRussiaSaudi ArabiaScotlandSenegalSerbiaSierra LeoneSingaporeSomaliaSouth AfricaSouth AmericaSouth Central AsiaSouth Eastern AsiaSouthern EuropeSpainSri LankaSt. Vincent and the GrenadinesSudanSwedenSwitzerlandSyriaTaiwanThailandTrinidad and TobagoTurkeyUgandaUkraineUruguayUzbekistanVenezuelaVietnamWest IndiesWestern AfricaWestern AsiaWestern EuropeYemenZaireZimbabweAzores
4 or more Vehicles in Household
Income
Poverty
Unemployment
Labor Participation
Family Structure
Vehicle Availability
Education Level
Disability

4 or more Vehicles in Household Comparison

Osage

Immigrants from Afghanistan

Exceptional
Exceptional
7.8%
4 OR MORE VEHICLES IN HOUSEHOLD
100.0/ 100
METRIC RATING
47th/ 347
METRIC RANK
7.1%
4 OR MORE VEHICLES IN HOUSEHOLD
99.3/ 100
METRIC RATING
93rd/ 347
METRIC RANK

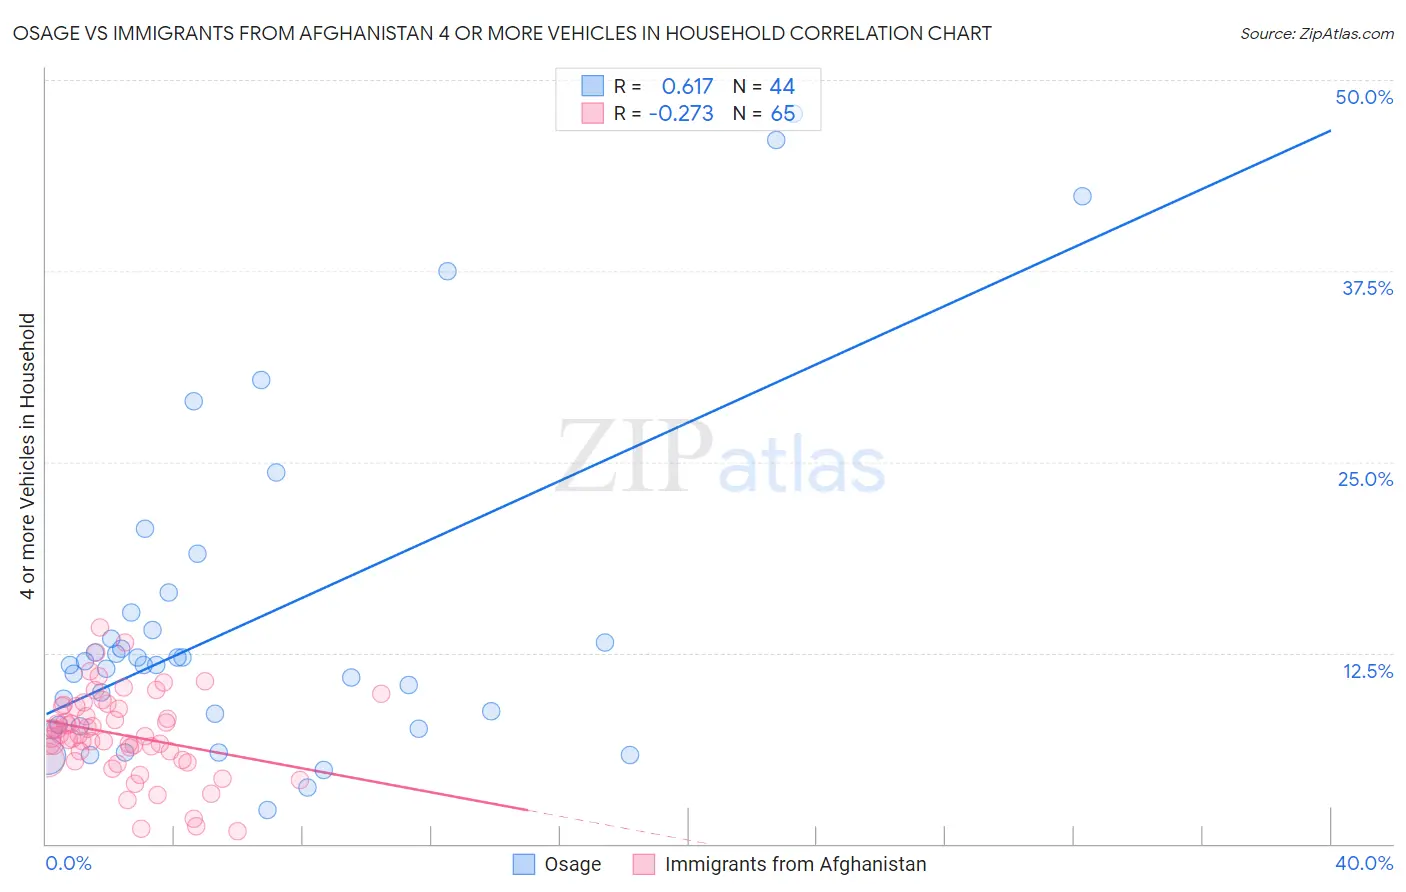
Osage vs Immigrants from Afghanistan 4 or more Vehicles in Household Correlation Chart

The statistical analysis conducted on geographies consisting of 91,747,496 people shows a significant positive correlation between the proportion of Osage and percentage of households with 4 or more vehicles available in the United States with a correlation coefficient (R) of 0.617 and weighted average of 7.8%. Similarly, the statistical analysis conducted on geographies consisting of 147,290,341 people shows a weak negative correlation between the proportion of Immigrants from Afghanistan and percentage of households with 4 or more vehicles available in the United States with a correlation coefficient (R) of -0.273 and weighted average of 7.1%, a difference of 9.0%.
Osage vs Immigrants from Afghanistan 4 or more Vehicles in Household

4 or more Vehicles in Household Correlation Summary

MeasurementOsageImmigrants from Afghanistan
Minimum2.2%0.82%
Maximum47.8%14.1%
Range45.7%13.3%
Mean14.6%7.1%
Median11.7%7.1%
Interquartile 25% (IQ1)7.7%5.5%
Interquartile 75% (IQ3)14.6%9.0%
Interquartile Range (IQR)6.8%3.5%
Standard Deviation (Sample)11.0%2.8%
Standard Deviation (Population)10.9%2.8%

Similar Demographics by 4 or more Vehicles in Household

Demographics Similar to Osage by 4 or more Vehicles in Household

In terms of 4 or more vehicles in household, the demographic groups most similar to Osage are Crow (7.8%, a difference of 0.16%), Swiss (7.8%, a difference of 0.17%), Choctaw (7.8%, a difference of 0.33%), Cherokee (7.7%, a difference of 0.36%), and Bhutanese (7.8%, a difference of 0.38%).
DemographicsRating | Rank4 or more Vehicles in Household
Spanish
100.0
/100
|
#40
Exceptional
7.9%
Pima
100.0
/100
|
#41
Exceptional
7.9%
Salvadorans
100.0
/100
|
#42
Exceptional
7.8%
Fijians
100.0
/100
|
#43
Exceptional
7.8%
Bhutanese
100.0
/100
|
#44
Exceptional
7.8%
Choctaw
100.0
/100
|
#45
Exceptional
7.8%
Crow
100.0
/100
|
#46
Exceptional
7.8%
Osage
100.0
/100
|
#47
Exceptional
7.8%
Swiss
100.0
/100
|
#48
Exceptional
7.8%
Cherokee
100.0
/100
|
#49
Exceptional
7.7%
Immigrants | El Salvador
100.0
/100
|
#50
Exceptional
7.7%
Immigrants | Laos
100.0
/100
|
#51
Exceptional
7.7%
Japanese
100.0
/100
|
#52
Exceptional
7.7%
Malaysians
100.0
/100
|
#53
Exceptional
7.7%
Dutch
100.0
/100
|
#54
Exceptional
7.7%

Demographics Similar to Immigrants from Afghanistan by 4 or more Vehicles in Household

In terms of 4 or more vehicles in household, the demographic groups most similar to Immigrants from Afghanistan are Dutch West Indian (7.1%, a difference of 0.010%), Immigrants from Latin America (7.1%, a difference of 0.17%), Czechoslovakian (7.1%, a difference of 0.22%), Central American (7.1%, a difference of 0.23%), and Assyrian/Chaldean/Syriac (7.2%, a difference of 0.33%).
DemographicsRating | Rank4 or more Vehicles in Household
Immigrants | Indonesia
99.6
/100
|
#86
Exceptional
7.2%
Delaware
99.6
/100
|
#87
Exceptional
7.2%
Immigrants | Nonimmigrants
99.6
/100
|
#88
Exceptional
7.2%
British
99.6
/100
|
#89
Exceptional
7.2%
Creek
99.6
/100
|
#90
Exceptional
7.2%
Assyrians/Chaldeans/Syriacs
99.4
/100
|
#91
Exceptional
7.2%
Immigrants | Latin America
99.4
/100
|
#92
Exceptional
7.1%
Immigrants | Afghanistan
99.3
/100
|
#93
Exceptional
7.1%
Dutch West Indians
99.3
/100
|
#94
Exceptional
7.1%
Czechoslovakians
99.3
/100
|
#95
Exceptional
7.1%
Central Americans
99.3
/100
|
#96
Exceptional
7.1%
Celtics
99.1
/100
|
#97
Exceptional
7.1%
Irish
99.0
/100
|
#98
Exceptional
7.1%
Seminole
98.8
/100
|
#99
Exceptional
7.0%
Taiwanese
98.7
/100
|
#100
Exceptional
7.0%