Kiowa Unemployment Among Women with Children Ages 6 to 17 years

COMPARE

Kiowa
Race
Ancestry
AfghanAfricanAlaska NativeAlaskan AthabascanAlbanianAleutAlsatianAmericanApacheArabArapahoArgentineanArmenianAssyrian/Chaldean/SyriacAustralianAustrianBahamianBangladeshiBarbadianBasqueBelgianBelizeanBermudanBhutaneseBlackfeetBolivianBrazilianBritishBritish West IndianBulgarianBurmeseCajunCambodianCanadianCape VerdeanCarpatho RusynCelticCentral AmericanCentral American IndianCherokeeCheyenneChickasawChileanChineseChippewaChoctawColombianColvilleComancheCosta RicanCreeCreekCroatianCrowCubanCypriotCzechCzechoslovakianDanishDelawareDominicanDutchDutch West IndianEastern EuropeanEcuadorianEgyptianEnglishEstonianEthiopianEuropeanFijianFilipinoFinnishFrenchFrench American IndianFrench CanadianGermanGerman RussianGhanaianGreekGuamanian/ChamorroGuatemalanGuyaneseHaitianHmongHonduranHopiHoumaHungarianIcelanderIndian (Asian)IndonesianInupiatIranianIraqiIrishIroquoisIsraeliItalianJamaicanJapaneseJordanianKenyanKiowaKoreanLaotianLatvianLebaneseLiberianLithuanianLumbeeLuxembourgerMacedonianMalaysianMalteseMarshalleseMenomineeMexicanMexican American IndianMongolianMoroccanNative HawaiianNavajoNepaleseNew ZealanderNicaraguanNigerianNorthern EuropeanNorwegianOkinawanOsageOttawaPaiutePakistaniPalestinianPanamanianParaguayanPennsylvania GermanPeruvianPimaPolishPortuguesePotawatomiPuebloPuerto RicanPuget Sound SalishRomanianRussianSalvadoranSamoanScandinavianScotch-IrishScottishSeminoleSenegaleseSerbianShoshoneSierra LeoneanSiouxSlavicSlovakSloveneSomaliSouth AfricanSouth AmericanSouth American IndianSoviet UnionSpaniardSpanishSpanish AmericanSpanish American IndianSri LankanSubsaharan AfricanSudaneseSwedishSwissSyrianTaiwaneseThaiTlingit-HaidaTohono O'OdhamTonganTrinidadian and TobagonianTsimshianTurkishU.S. Virgin IslanderUgandanUkrainianUruguayanUteVenezuelanVietnameseWelshWest IndianYakamaYaquiYugoslavianYumanYup'ikZimbabwean
Immigration
NonimmigrantsImmigrantsAfghanistanAfricaAlbaniaArgentinaArmeniaAsiaAustraliaAustriaBahamasBangladeshBarbadosBelarusBelgiumBelizeBoliviaBosnia and HerzegovinaBrazilBulgariaBurma/MyanmarCabo VerdeCambodiaCameroonCanadaCaribbeanCentral AmericaChileChinaColombiaCongoCosta RicaCroatiaCubaCzechoslovakiaDenmarkDominicaDominican RepublicEastern AfricaEastern AsiaEastern EuropeEcuadorEgyptEl SalvadorEnglandEritreaEthiopiaEuropeFijiFranceGermanyGhanaGreeceGrenadaGuatemalaGuyanaHaitiHondurasHong KongHungaryIndiaIndonesiaIranIraqIrelandIsraelItalyJamaicaJapanJordanKazakhstanKenyaKoreaKuwaitLaosLatin AmericaLatviaLebanonLiberiaLithuaniaMalaysiaMexicoMicronesiaMiddle AfricaMoldovaMoroccoNepalNetherlandsNicaraguaNigeriaNorth AmericaNorth MacedoniaNorthern AfricaNorthern EuropeNorwayOceaniaPakistanPanamaPeruPhilippinesPolandPortugalRomaniaRussiaSaudi ArabiaScotlandSenegalSerbiaSierra LeoneSingaporeSomaliaSouth AfricaSouth AmericaSouth Central AsiaSouth Eastern AsiaSouthern EuropeSpainSri LankaSt. Vincent and the GrenadinesSudanSwedenSwitzerlandSyriaTaiwanThailandTrinidad and TobagoTurkeyUgandaUkraineUruguayUzbekistanVenezuelaVietnamWest IndiesWestern AfricaWestern AsiaWestern EuropeYemenZaireZimbabweAzores
Select to Compare
Race
Ancestry
AfghanAfricanAlaska NativeAlaskan AthabascanAlbanianAleutAlsatianAmericanApacheArabArapahoArgentineanArmenianAssyrian/Chaldean/SyriacAustralianAustrianBahamianBangladeshiBarbadianBasqueBelgianBelizeanBermudanBhutaneseBlackfeetBolivianBrazilianBritishBritish West IndianBulgarianBurmeseCajunCambodianCanadianCape VerdeanCarpatho RusynCelticCentral AmericanCentral American IndianCherokeeCheyenneChickasawChileanChineseChippewaChoctawColombianColvilleComancheCosta RicanCreeCreekCroatianCrowCubanCypriotCzechCzechoslovakianDanishDelawareDominicanDutchDutch West IndianEastern EuropeanEcuadorianEgyptianEnglishEstonianEthiopianEuropeanFijianFilipinoFinnishFrenchFrench American IndianFrench CanadianGermanGerman RussianGhanaianGreekGuamanian/ChamorroGuatemalanGuyaneseHaitianHmongHonduranHopiHoumaHungarianIcelanderIndian (Asian)IndonesianInupiatIranianIraqiIrishIroquoisIsraeliItalianJamaicanJapaneseJordanianKenyanKoreanLaotianLatvianLebaneseLiberianLithuanianLumbeeLuxembourgerMacedonianMalaysianMalteseMarshalleseMenomineeMexicanMexican American IndianMongolianMoroccanNative HawaiianNavajoNepaleseNew ZealanderNicaraguanNigerianNorthern EuropeanNorwegianOkinawanOsageOttawaPaiutePakistaniPalestinianPanamanianParaguayanPennsylvania GermanPeruvianPimaPolishPortuguesePotawatomiPuebloPuerto RicanPuget Sound SalishRomanianRussianSalvadoranSamoanScandinavianScotch-IrishScottishSeminoleSenegaleseSerbianShoshoneSierra LeoneanSiouxSlavicSlovakSloveneSomaliSouth AfricanSouth AmericanSouth American IndianSoviet UnionSpaniardSpanishSpanish AmericanSpanish American IndianSri LankanSubsaharan AfricanSudaneseSwedishSwissSyrianTaiwaneseThaiTlingit-HaidaTohono O'OdhamTonganTrinidadian and TobagonianTsimshianTurkishU.S. Virgin IslanderUgandanUkrainianUruguayanUteVenezuelanVietnameseWelshWest IndianYakamaYaquiYugoslavianYumanYup'ikZimbabwean
Immigration
NonimmigrantsImmigrantsAfghanistanAfricaAlbaniaArgentinaArmeniaAsiaAustraliaAustriaBahamasBangladeshBarbadosBelarusBelgiumBelizeBoliviaBosnia and HerzegovinaBrazilBulgariaBurma/MyanmarCabo VerdeCambodiaCameroonCanadaCaribbeanCentral AmericaChileChinaColombiaCongoCosta RicaCroatiaCubaCzechoslovakiaDenmarkDominicaDominican RepublicEastern AfricaEastern AsiaEastern EuropeEcuadorEgyptEl SalvadorEnglandEritreaEthiopiaEuropeFijiFranceGermanyGhanaGreeceGrenadaGuatemalaGuyanaHaitiHondurasHong KongHungaryIndiaIndonesiaIranIraqIrelandIsraelItalyJamaicaJapanJordanKazakhstanKenyaKoreaKuwaitLaosLatin AmericaLatviaLebanonLiberiaLithuaniaMalaysiaMexicoMicronesiaMiddle AfricaMoldovaMoroccoNepalNetherlandsNicaraguaNigeriaNorth AmericaNorth MacedoniaNorthern AfricaNorthern EuropeNorwayOceaniaPakistanPanamaPeruPhilippinesPolandPortugalRomaniaRussiaSaudi ArabiaScotlandSenegalSerbiaSierra LeoneSingaporeSomaliaSouth AfricaSouth AmericaSouth Central AsiaSouth Eastern AsiaSouthern EuropeSpainSri LankaSt. Vincent and the GrenadinesSudanSwedenSwitzerlandSyriaTaiwanThailandTrinidad and TobagoTurkeyUgandaUkraineUruguayUzbekistanVenezuelaVietnamWest IndiesWestern AfricaWestern AsiaWestern EuropeYemenZaireZimbabweAzores
Unemployment Among Women with Children Ages 6 to 17 years
Income
Poverty
Unemployment
Labor Participation
Family Structure
Vehicle Availability
Education Level
Disability

Kiowa Unemployment Among Women with Children Ages 6 to 17 years
Tragic

9.6%
UNEMPLOYMENT | WOMEN W/ CHILDREN 6 TO 17
0.1/ 100
METRIC RATING
272nd/ 347
METRIC RANK

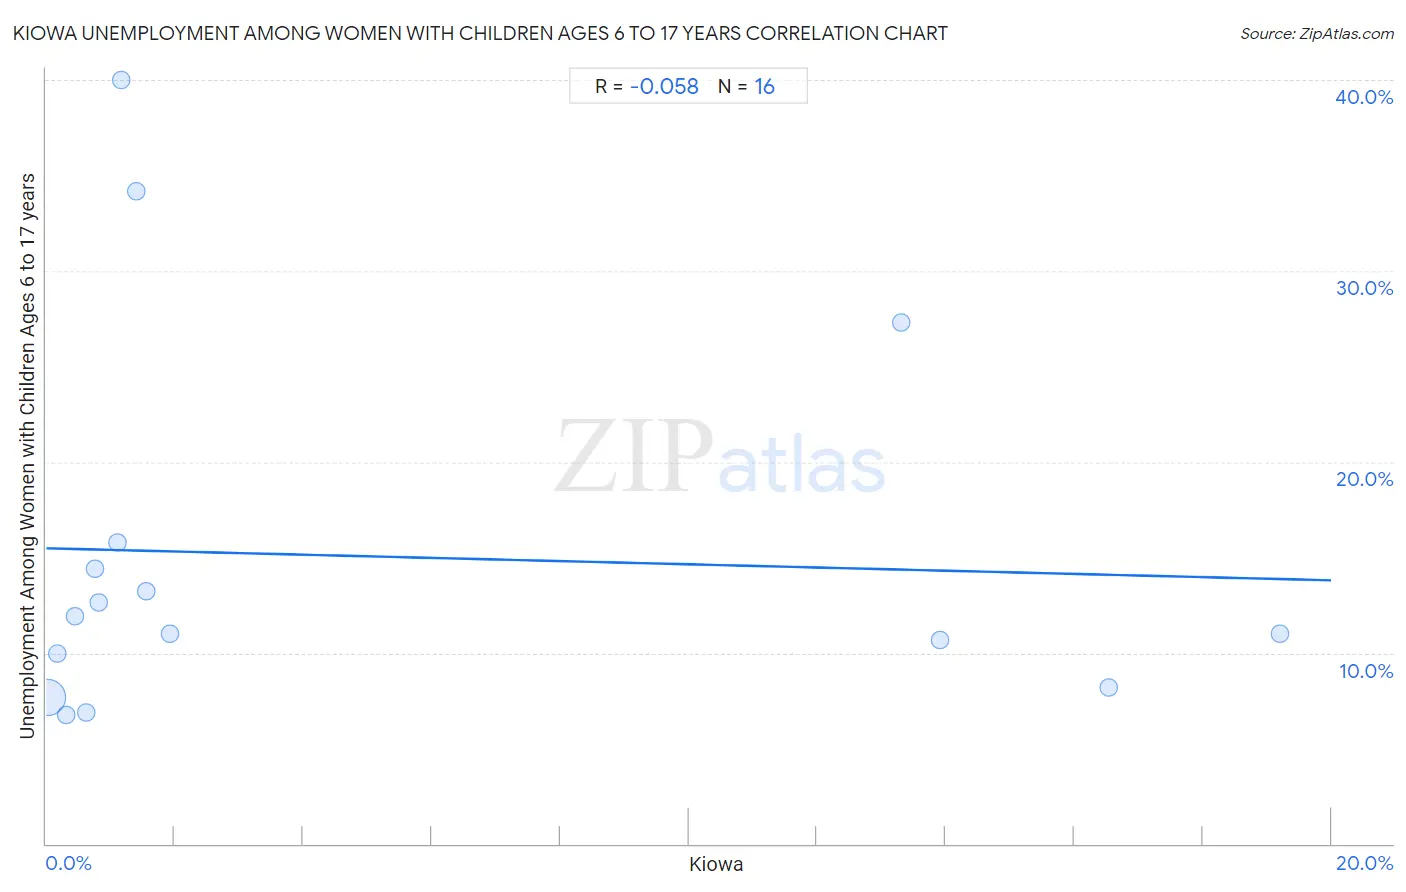
Kiowa Unemployment Among Women with Children Ages 6 to 17 years Correlation Chart

The statistical analysis conducted on geographies consisting of 51,587,484 people shows a slight negative correlation between the proportion of Kiowa and unemployment rate among women with children between the ages 6 and 17 in the United States with a correlation coefficient (R) of -0.058 and weighted average of 9.6%. On average, for every 1% (one percent) increase in Kiowa within a typical geography, there is a decrease of 0.084% in unemployment rate among women with children between the ages 6 and 17.
Kiowa Unemployment Among Women with Children Ages 6 to 17 years
It is essential to understand that the correlation between the percentage of Kiowa and unemployment rate among women with children between the ages 6 and 17 does not imply a direct cause-and-effect relationship. It remains uncertain whether the presence of Kiowa influences an upward or downward trend in the level of unemployment rate among women with children between the ages 6 and 17 within an area, or if Kiowa simply ended up residing in those areas with higher or lower levels of unemployment rate among women with children between the ages 6 and 17 due to other factors.

Demographics Similar to Kiowa by Unemployment Among Women with Children Ages 6 to 17 years

In terms of unemployment among women with children ages 6 to 17 years, the demographic groups most similar to Kiowa are White/Caucasian (9.6%, a difference of 0.010%), Immigrants from Latin America (9.6%, a difference of 0.060%), Aleut (9.6%, a difference of 0.060%), Immigrants from Nicaragua (9.6%, a difference of 0.46%), and U.S. Virgin Islander (9.7%, a difference of 0.50%).
DemographicsRating | RankUnemployment Among Women with Children Ages 6 to 17 years
West Indians
0.4
/100
|
#265
Tragic
9.5%
Immigrants from Jamaica
0.3
/100
|
#266
Tragic
9.5%
Irish
0.3
/100
|
#267
Tragic
9.5%
Ghanaians
0.2
/100
|
#268
Tragic
9.6%
Blackfeet
0.2
/100
|
#269
Tragic
9.6%
Immigrants from Nicaragua
0.2
/100
|
#270
Tragic
9.6%
Immigrants from Latin America
0.1
/100
|
#271
Tragic
9.6%
Kiowa
0.1
/100
|
#272
Tragic
9.6%
Whites/Caucasians
0.1
/100
|
#273
Tragic
9.6%
Aleuts
0.1
/100
|
#274
Tragic
9.6%
U.S. Virgin Islanders
0.1
/100
|
#275
Tragic
9.7%
Immigrants from Portugal
0.1
/100
|
#276
Tragic
9.7%
British West Indians
0.1
/100
|
#277
Tragic
9.7%
French
0.1
/100
|
#278
Tragic
9.7%
Scotch-Irish
0.1
/100
|
#279
Tragic
9.7%

Kiowa Unemployment Among Women with Children Ages 6 to 17 years Correlation Summary

MeasurementKiowa DataUnemployment Among Women with Children Ages 6 to 17 years Data
Minimum0.012%6.8%
Maximum19.2%40.0%
Range19.2%33.2%
Mean4.6%15.1%
Median1.1%11.5%
Interquartile 25% (IQ1)0.53%9.1%
Interquartile 75% (IQ3)7.6%15.1%
Interquartile Range (IQR)7.1%6.0%
Standard Deviation (Sample)6.8%9.9%
Standard Deviation (Population)6.6%9.6%

Correlation Details

Kiowa PercentileSample SizeUnemployment Among Women with Children Ages 6 to 17 years
[
0.0%
-
0.5%
]
0.012%
49,818,9667.7%
[
0.0%
-
0.5%
]
0.18%
969,02110.0%
[
0.0%
-
0.5%
]
0.31%
394,8496.8%
[
0.0%
-
0.5%
]
0.45%
97,47211.9%
[
0.5%
-
1.0%
]
0.62%
48,0276.8%
[
0.5%
-
1.0%
]
0.76%
26,03514.4%
[
0.5%
-
1.0%
]
0.81%
80,42312.6%
[
1.0%
-
1.5%
]
1.11%
91,02315.8%
[
1.0%
-
1.5%
]
1.17%
25640.0%
[
1.0%
-
1.5%
]
1.40%
1,71334.2%
[
1.5%
-
2.0%
]
1.56%
21,42713.2%
[
1.5%
-
2.0%
]
1.93%
20,63011.0%
[
13.0%
-
13.5%
]
13.31%
1,58527.3%
[
13.5%
-
14.0%
]
13.91%
2,30110.7%
[
16.5%
-
17.0%
]
16.54%
8,0338.2%
[
19.0%
-
19.5%
]
19.20%
5,72311.0%