Kiowa Receiving Food Stamps
COMPARE
Kiowa
Select to Compare
Receiving Food Stamps
Kiowa Receiving Food Stamps
14.9%
PUBLIC INCOME | FOOD STAMPS
0.0/ 100
METRIC RATING
279th/ 347
METRIC RANK
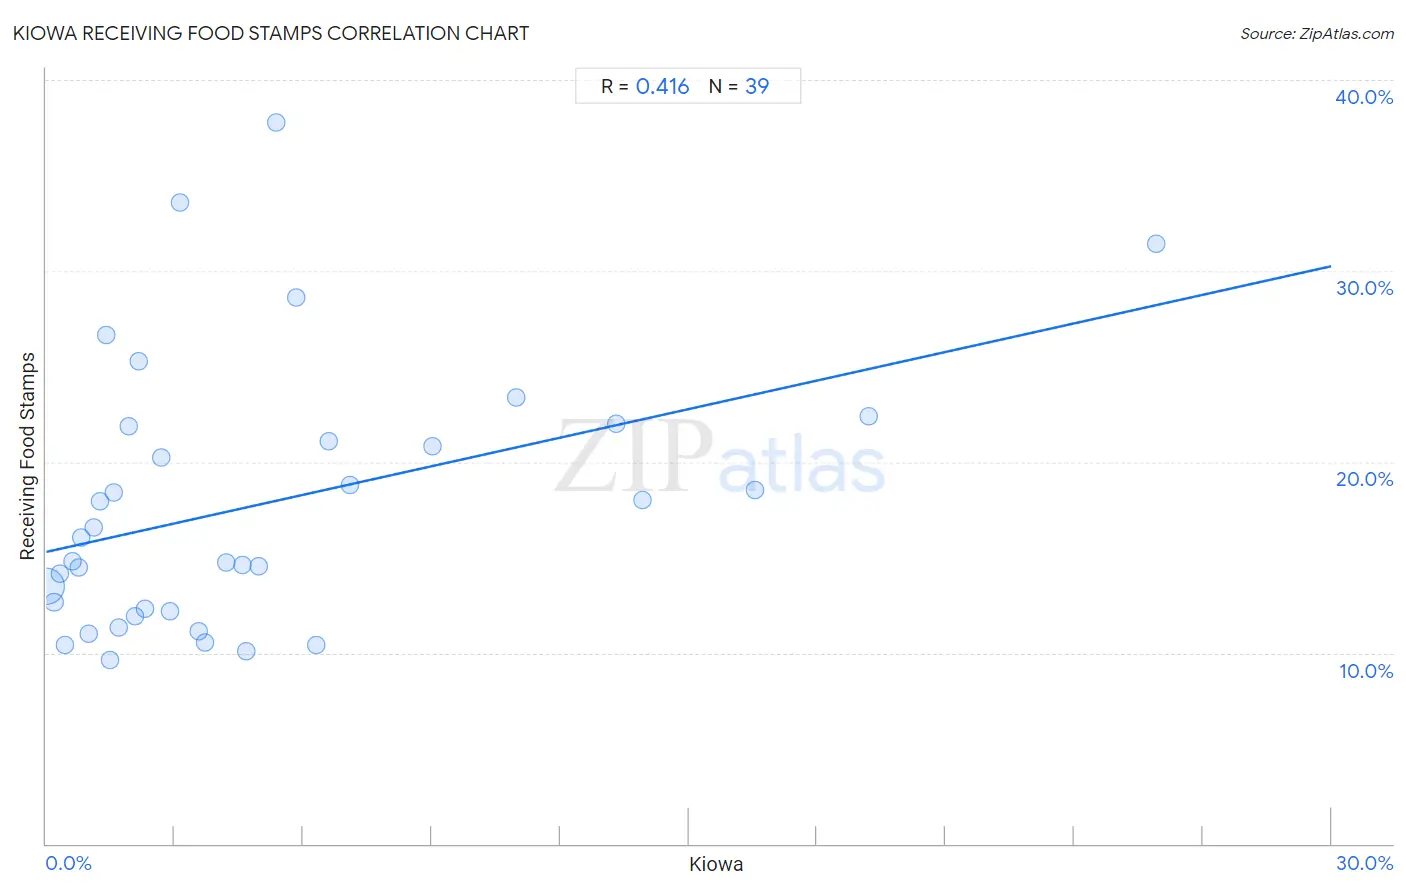
Kiowa Receiving Food Stamps Correlation Chart
The statistical analysis conducted on geographies consisting of 56,088,219 people shows a moderate positive correlation between the proportion of Kiowa and percentage of population receiving government assistance and/or food stamps in the United States with a correlation coefficient (R) of 0.416 and weighted average of 14.9%. On average, for every 1% (one percent) increase in Kiowa within a typical geography, there is an increase of 0.50% in percentage of population receiving government assistance and/or food stamps.
It is essential to understand that the correlation between the percentage of Kiowa and percentage of population receiving government assistance and/or food stamps does not imply a direct cause-and-effect relationship. It remains uncertain whether the presence of Kiowa influences an upward or downward trend in the level of percentage of population receiving government assistance and/or food stamps within an area, or if Kiowa simply ended up residing in those areas with higher or lower levels of percentage of population receiving government assistance and/or food stamps due to other factors.
Demographics Similar to Kiowa by Receiving Food Stamps
In terms of receiving food stamps, the demographic groups most similar to Kiowa are Ecuadorian (14.9%, a difference of 0.050%), Belizean (14.8%, a difference of 0.27%), Spanish American Indian (14.9%, a difference of 0.37%), Seminole (14.8%, a difference of 0.40%), and Liberian (14.8%, a difference of 0.45%).
| Demographics | Rating | Rank | Receiving Food Stamps |
| Chippewa | 0.1 /100 | #272 | Tragic 14.7% |
| Alaskan Athabascans | 0.1 /100 | #273 | Tragic 14.7% |
| Immigrants from Western Africa | 0.1 /100 | #274 | Tragic 14.7% |
| Ute | 0.1 /100 | #275 | Tragic 14.7% |
| Liberians | 0.1 /100 | #276 | Tragic 14.8% |
| Seminole | 0.1 /100 | #277 | Tragic 14.8% |
| Belizeans | 0.1 /100 | #278 | Tragic 14.8% |
| Kiowa | 0.0 /100 | #279 | Tragic 14.9% |
| Ecuadorians | 0.0 /100 | #280 | Tragic 14.9% |
| Spanish American Indians | 0.0 /100 | #281 | Tragic 14.9% |
| Immigrants from Central America | 0.0 /100 | #282 | Tragic 15.0% |
| Bangladeshis | 0.0 /100 | #283 | Tragic 15.0% |
| Immigrants from Ecuador | 0.0 /100 | #284 | Tragic 15.0% |
| Immigrants from Liberia | 0.0 /100 | #285 | Tragic 15.1% |
| Africans | 0.0 /100 | #286 | Tragic 15.1% |
Kiowa Receiving Food Stamps Correlation Summary
| Measurement | Kiowa Data | Receiving Food Stamps Data |
| Minimum | 0.014% | 9.6% |
| Maximum | 25.9% | 37.8% |
| Range | 25.9% | 28.2% |
| Mean | 5.0% | 17.8% |
| Median | 2.9% | 16.0% |
| Interquartile 25% (IQ1) | 1.2% | 12.2% |
| Interquartile 75% (IQ3) | 6.3% | 21.9% |
| Interquartile Range (IQR) | 5.1% | 9.7% |
| Standard Deviation (Sample) | 5.8% | 6.9% |
| Standard Deviation (Population) | 5.7% | 6.9% |
Correlation Details
| Kiowa Percentile | Sample Size | Receiving Food Stamps |
[ 0.0% - 0.5% ] 0.014% | 53,191,054 | 13.5% |
[ 0.0% - 0.5% ] 0.18% | 1,500,870 | 12.7% |
[ 0.0% - 0.5% ] 0.31% | 603,478 | 14.2% |
[ 0.0% - 0.5% ] 0.45% | 340,723 | 10.4% |
[ 0.5% - 1.0% ] 0.60% | 91,763 | 14.8% |
[ 0.5% - 1.0% ] 0.75% | 43,569 | 14.5% |
[ 0.5% - 1.0% ] 0.82% | 111,877 | 16.0% |
[ 0.5% - 1.0% ] 0.98% | 3,059 | 11.0% |
[ 1.0% - 1.5% ] 1.12% | 106,964 | 16.5% |
[ 1.0% - 1.5% ] 1.25% | 9,619 | 17.9% |
[ 1.0% - 1.5% ] 1.40% | 1,713 | 26.6% |
[ 1.0% - 1.5% ] 1.47% | 4,747 | 9.6% |
[ 1.5% - 2.0% ] 1.57% | 21,911 | 18.4% |
[ 1.5% - 2.0% ] 1.70% | 176 | 11.3% |
[ 1.5% - 2.0% ] 1.92% | 22,810 | 21.9% |
[ 2.0% - 2.5% ] 2.07% | 1,065 | 11.9% |
[ 2.0% - 2.5% ] 2.17% | 1,196 | 25.3% |
[ 2.0% - 2.5% ] 2.29% | 1,613 | 12.3% |
[ 2.5% - 3.0% ] 2.68% | 783 | 20.2% |
[ 2.5% - 3.0% ] 2.88% | 800 | 12.2% |
[ 3.0% - 3.5% ] 3.14% | 542 | 33.6% |
[ 3.5% - 4.0% ] 3.56% | 478 | 11.1% |
[ 3.5% - 4.0% ] 3.72% | 1,613 | 10.5% |
[ 4.0% - 4.5% ] 4.22% | 166 | 14.7% |
[ 4.5% - 5.0% ] 4.58% | 961 | 14.6% |
[ 4.5% - 5.0% ] 4.68% | 278 | 10.1% |
[ 4.5% - 5.0% ] 4.97% | 1,207 | 14.6% |
[ 5.0% - 5.5% ] 5.36% | 373 | 37.8% |
[ 5.5% - 6.0% ] 5.83% | 240 | 28.6% |
[ 6.0% - 6.5% ] 6.32% | 1,377 | 10.4% |
[ 6.5% - 7.0% ] 6.59% | 1,154 | 21.1% |
[ 7.0% - 7.5% ] 7.08% | 1,526 | 18.8% |
[ 9.0% - 9.5% ] 9.02% | 499 | 20.8% |
[ 10.5% - 11.0% ] 10.96% | 292 | 23.4% |
[ 13.0% - 13.5% ] 13.31% | 1,585 | 22.0% |
[ 13.5% - 14.0% ] 13.91% | 2,301 | 18.0% |
[ 16.5% - 17.0% ] 16.54% | 8,033 | 18.5% |
[ 19.0% - 19.5% ] 19.20% | 5,723 | 22.4% |
[ 25.5% - 26.0% ] 25.93% | 81 | 31.4% |