Kiowa College, 1 year or more

COMPARE

Kiowa
Race
Ancestry
AfghanAfricanAlaska NativeAlaskan AthabascanAlbanianAleutAlsatianAmericanApacheArabArapahoArgentineanArmenianAssyrian/Chaldean/SyriacAustralianAustrianBahamianBangladeshiBarbadianBasqueBelgianBelizeanBermudanBhutaneseBlackfeetBolivianBrazilianBritishBritish West IndianBulgarianBurmeseCajunCambodianCanadianCape VerdeanCarpatho RusynCelticCentral AmericanCentral American IndianCherokeeCheyenneChickasawChileanChineseChippewaChoctawColombianColvilleComancheCosta RicanCreeCreekCroatianCrowCubanCypriotCzechCzechoslovakianDanishDelawareDominicanDutchDutch West IndianEastern EuropeanEcuadorianEgyptianEnglishEstonianEthiopianEuropeanFijianFilipinoFinnishFrenchFrench American IndianFrench CanadianGermanGerman RussianGhanaianGreekGuamanian/ChamorroGuatemalanGuyaneseHaitianHmongHonduranHopiHoumaHungarianIcelanderIndian (Asian)IndonesianInupiatIranianIraqiIrishIroquoisIsraeliItalianJamaicanJapaneseJordanianKenyanKiowaKoreanLaotianLatvianLebaneseLiberianLithuanianLumbeeLuxembourgerMacedonianMalaysianMalteseMarshalleseMenomineeMexicanMexican American IndianMongolianMoroccanNative HawaiianNavajoNepaleseNew ZealanderNicaraguanNigerianNorthern EuropeanNorwegianOkinawanOsageOttawaPaiutePakistaniPalestinianPanamanianParaguayanPennsylvania GermanPeruvianPimaPolishPortuguesePotawatomiPuebloPuerto RicanPuget Sound SalishRomanianRussianSalvadoranSamoanScandinavianScotch-IrishScottishSeminoleSenegaleseSerbianShoshoneSierra LeoneanSiouxSlavicSlovakSloveneSomaliSouth AfricanSouth AmericanSouth American IndianSoviet UnionSpaniardSpanishSpanish AmericanSpanish American IndianSri LankanSubsaharan AfricanSudaneseSwedishSwissSyrianTaiwaneseThaiTlingit-HaidaTohono O'OdhamTonganTrinidadian and TobagonianTsimshianTurkishU.S. Virgin IslanderUgandanUkrainianUruguayanUteVenezuelanVietnameseWelshWest IndianYakamaYaquiYugoslavianYumanYup'ikZimbabwean
Immigration
NonimmigrantsImmigrantsAfghanistanAfricaAlbaniaArgentinaArmeniaAsiaAustraliaAustriaBahamasBangladeshBarbadosBelarusBelgiumBelizeBoliviaBosnia and HerzegovinaBrazilBulgariaBurma/MyanmarCabo VerdeCambodiaCameroonCanadaCaribbeanCentral AmericaChileChinaColombiaCongoCosta RicaCroatiaCubaCzechoslovakiaDenmarkDominicaDominican RepublicEastern AfricaEastern AsiaEastern EuropeEcuadorEgyptEl SalvadorEnglandEritreaEthiopiaEuropeFijiFranceGermanyGhanaGreeceGrenadaGuatemalaGuyanaHaitiHondurasHong KongHungaryIndiaIndonesiaIranIraqIrelandIsraelItalyJamaicaJapanJordanKazakhstanKenyaKoreaKuwaitLaosLatin AmericaLatviaLebanonLiberiaLithuaniaMalaysiaMexicoMicronesiaMiddle AfricaMoldovaMoroccoNepalNetherlandsNicaraguaNigeriaNorth AmericaNorth MacedoniaNorthern AfricaNorthern EuropeNorwayOceaniaPakistanPanamaPeruPhilippinesPolandPortugalRomaniaRussiaSaudi ArabiaScotlandSenegalSerbiaSierra LeoneSingaporeSomaliaSouth AfricaSouth AmericaSouth Central AsiaSouth Eastern AsiaSouthern EuropeSpainSri LankaSt. Vincent and the GrenadinesSudanSwedenSwitzerlandSyriaTaiwanThailandTrinidad and TobagoTurkeyUgandaUkraineUruguayUzbekistanVenezuelaVietnamWest IndiesWestern AfricaWestern AsiaWestern EuropeYemenZaireZimbabweAzores
Select to Compare
Race
Ancestry
AfghanAfricanAlaska NativeAlaskan AthabascanAlbanianAleutAlsatianAmericanApacheArabArapahoArgentineanArmenianAssyrian/Chaldean/SyriacAustralianAustrianBahamianBangladeshiBarbadianBasqueBelgianBelizeanBermudanBhutaneseBlackfeetBolivianBrazilianBritishBritish West IndianBulgarianBurmeseCajunCambodianCanadianCape VerdeanCarpatho RusynCelticCentral AmericanCentral American IndianCherokeeCheyenneChickasawChileanChineseChippewaChoctawColombianColvilleComancheCosta RicanCreeCreekCroatianCrowCubanCypriotCzechCzechoslovakianDanishDelawareDominicanDutchDutch West IndianEastern EuropeanEcuadorianEgyptianEnglishEstonianEthiopianEuropeanFijianFilipinoFinnishFrenchFrench American IndianFrench CanadianGermanGerman RussianGhanaianGreekGuamanian/ChamorroGuatemalanGuyaneseHaitianHmongHonduranHopiHoumaHungarianIcelanderIndian (Asian)IndonesianInupiatIranianIraqiIrishIroquoisIsraeliItalianJamaicanJapaneseJordanianKenyanKoreanLaotianLatvianLebaneseLiberianLithuanianLumbeeLuxembourgerMacedonianMalaysianMalteseMarshalleseMenomineeMexicanMexican American IndianMongolianMoroccanNative HawaiianNavajoNepaleseNew ZealanderNicaraguanNigerianNorthern EuropeanNorwegianOkinawanOsageOttawaPaiutePakistaniPalestinianPanamanianParaguayanPennsylvania GermanPeruvianPimaPolishPortuguesePotawatomiPuebloPuerto RicanPuget Sound SalishRomanianRussianSalvadoranSamoanScandinavianScotch-IrishScottishSeminoleSenegaleseSerbianShoshoneSierra LeoneanSiouxSlavicSlovakSloveneSomaliSouth AfricanSouth AmericanSouth American IndianSoviet UnionSpaniardSpanishSpanish AmericanSpanish American IndianSri LankanSubsaharan AfricanSudaneseSwedishSwissSyrianTaiwaneseThaiTlingit-HaidaTohono O'OdhamTonganTrinidadian and TobagonianTsimshianTurkishU.S. Virgin IslanderUgandanUkrainianUruguayanUteVenezuelanVietnameseWelshWest IndianYakamaYaquiYugoslavianYumanYup'ikZimbabwean
Immigration
NonimmigrantsImmigrantsAfghanistanAfricaAlbaniaArgentinaArmeniaAsiaAustraliaAustriaBahamasBangladeshBarbadosBelarusBelgiumBelizeBoliviaBosnia and HerzegovinaBrazilBulgariaBurma/MyanmarCabo VerdeCambodiaCameroonCanadaCaribbeanCentral AmericaChileChinaColombiaCongoCosta RicaCroatiaCubaCzechoslovakiaDenmarkDominicaDominican RepublicEastern AfricaEastern AsiaEastern EuropeEcuadorEgyptEl SalvadorEnglandEritreaEthiopiaEuropeFijiFranceGermanyGhanaGreeceGrenadaGuatemalaGuyanaHaitiHondurasHong KongHungaryIndiaIndonesiaIranIraqIrelandIsraelItalyJamaicaJapanJordanKazakhstanKenyaKoreaKuwaitLaosLatin AmericaLatviaLebanonLiberiaLithuaniaMalaysiaMexicoMicronesiaMiddle AfricaMoldovaMoroccoNepalNetherlandsNicaraguaNigeriaNorth AmericaNorth MacedoniaNorthern AfricaNorthern EuropeNorwayOceaniaPakistanPanamaPeruPhilippinesPolandPortugalRomaniaRussiaSaudi ArabiaScotlandSenegalSerbiaSierra LeoneSingaporeSomaliaSouth AfricaSouth AmericaSouth Central AsiaSouth Eastern AsiaSouthern EuropeSpainSri LankaSt. Vincent and the GrenadinesSudanSwedenSwitzerlandSyriaTaiwanThailandTrinidad and TobagoTurkeyUgandaUkraineUruguayUzbekistanVenezuelaVietnamWest IndiesWestern AfricaWestern AsiaWestern EuropeYemenZaireZimbabweAzores
College, 1 year or more
Income
Poverty
Unemployment
Labor Participation
Family Structure
Vehicle Availability
Education Level
Disability

Kiowa College, 1 year or more
Tragic

51.0%
COLLEGE, 1 YEAR OR MORE
0.0/ 100
METRIC RATING
320th/ 347
METRIC RANK

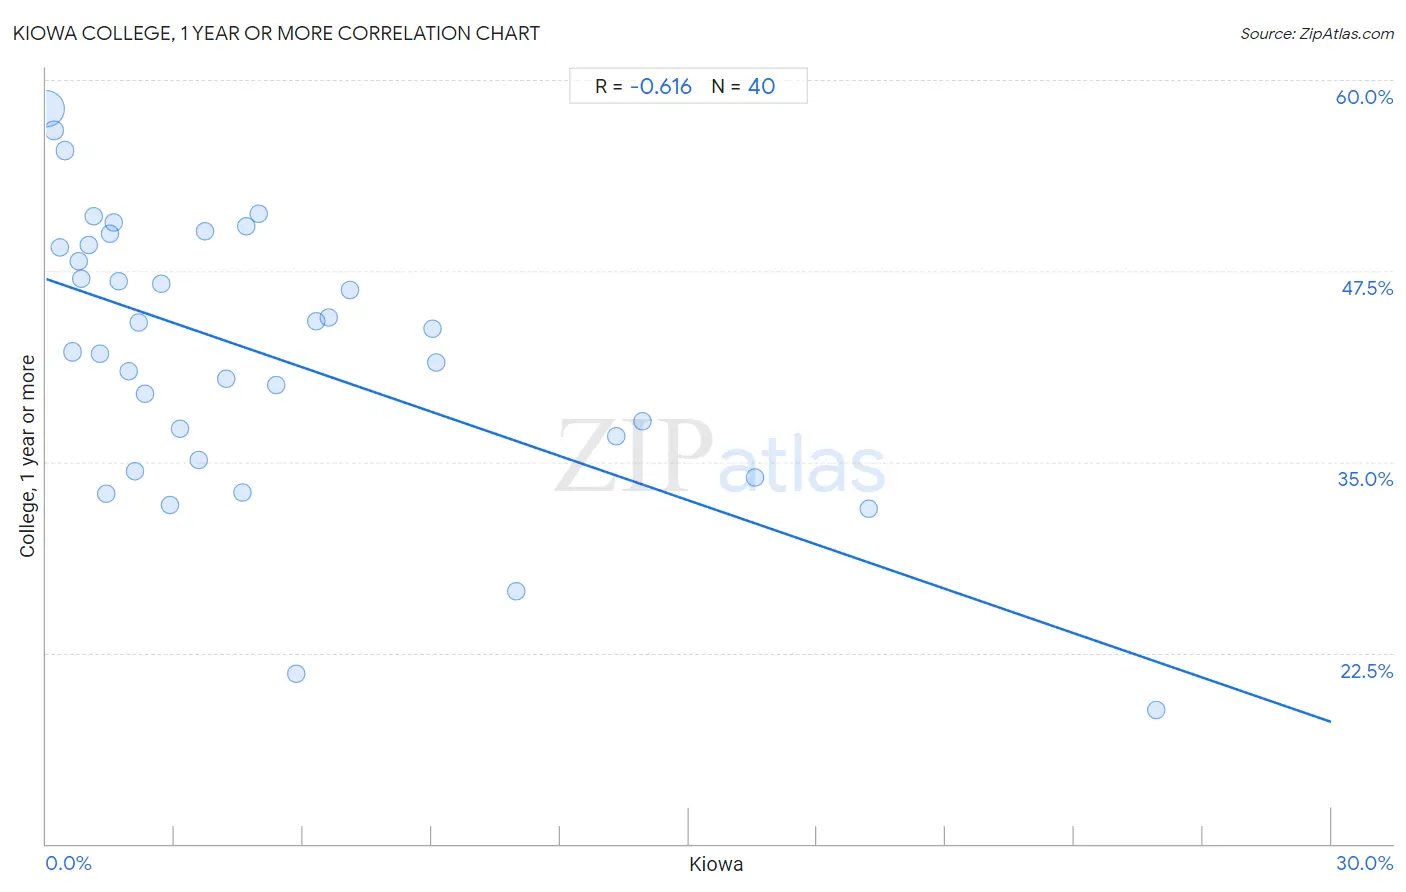
Kiowa College, 1 year or more Correlation Chart

The statistical analysis conducted on geographies consisting of 56,101,444 people shows a significant negative correlation between the proportion of Kiowa and percentage of population with at least college, 1 year or more education in the United States with a correlation coefficient (R) of -0.616 and weighted average of 51.0%. On average, for every 1% (one percent) increase in Kiowa within a typical geography, there is a decrease of 0.97% in percentage of population with at least college, 1 year or more education.
Kiowa College, 1 year or more
It is essential to understand that the correlation between the percentage of Kiowa and percentage of population with at least college, 1 year or more education does not imply a direct cause-and-effect relationship. It remains uncertain whether the presence of Kiowa influences an upward or downward trend in the level of percentage of population with at least college, 1 year or more education within an area, or if Kiowa simply ended up residing in those areas with higher or lower levels of percentage of population with at least college, 1 year or more education due to other factors.

Demographics Similar to Kiowa by College, 1 year or more

In terms of college, 1 year or more, the demographic groups most similar to Kiowa are Immigrants from El Salvador (51.0%, a difference of 0.060%), Hopi (50.9%, a difference of 0.12%), Immigrants from Honduras (51.0%, a difference of 0.15%), Hispanic or Latino (51.1%, a difference of 0.28%), and Navajo (50.8%, a difference of 0.31%).
DemographicsRating | RankCollege, 1 year or more
Immigrants from Caribbean
0.0
/100
|
#313
Tragic
51.4%
Fijians
0.0
/100
|
#314
Tragic
51.3%
Guatemalans
0.0
/100
|
#315
Tragic
51.2%
Cajuns
0.0
/100
|
#316
Tragic
51.2%
Hispanics or Latinos
0.0
/100
|
#317
Tragic
51.1%
Immigrants from Honduras
0.0
/100
|
#318
Tragic
51.0%
Immigrants from El Salvador
0.0
/100
|
#319
Tragic
51.0%
Kiowa
0.0
/100
|
#320
Tragic
51.0%
Hopi
0.0
/100
|
#321
Tragic
50.9%
Navajo
0.0
/100
|
#322
Tragic
50.8%
Immigrants from Guatemala
0.0
/100
|
#323
Tragic
50.7%
Immigrants from Cuba
0.0
/100
|
#324
Tragic
50.7%
Immigrants from Latin America
0.0
/100
|
#325
Tragic
50.7%
Dominicans
0.0
/100
|
#326
Tragic
50.6%
Menominee
0.0
/100
|
#327
Tragic
50.6%

Kiowa College, 1 year or more Correlation Summary

MeasurementKiowa DataCollege, 1 year or more Data
Minimum0.014%18.8%
Maximum25.9%58.1%
Range25.9%39.3%
Mean5.1%42.0%
Median3.0%43.0%
Interquartile 25% (IQ1)1.3%35.9%
Interquartile 75% (IQ3)6.5%49.1%
Interquartile Range (IQR)5.1%13.2%
Standard Deviation (Sample)5.7%9.0%
Standard Deviation (Population)5.7%8.9%

Correlation Details

Kiowa PercentileSample SizeCollege, 1 year or more
[
0.0%
-
0.5%
]
0.014%
53,191,05458.1%
[
0.0%
-
0.5%
]
0.18%
1,500,87056.7%
[
0.0%
-
0.5%
]
0.31%
603,47849.0%
[
0.0%
-
0.5%
]
0.45%
341,98455.4%
[
0.5%
-
1.0%
]
0.60%
91,76342.2%
[
0.5%
-
1.0%
]
0.75%
44,75248.1%
[
0.5%
-
1.0%
]
0.82%
111,87747.0%
[
0.5%
-
1.0%
]
0.98%
3,05949.2%
[
1.0%
-
1.5%
]
1.11%
117,25351.1%
[
1.0%
-
1.5%
]
1.25%
9,93542.1%
[
1.0%
-
1.5%
]
1.40%
1,71332.9%
[
1.0%
-
1.5%
]
1.47%
4,74749.9%
[
1.5%
-
2.0%
]
1.57%
21,91150.7%
[
1.5%
-
2.0%
]
1.70%
17646.8%
[
1.5%
-
2.0%
]
1.92%
22,81041.0%
[
2.0%
-
2.5%
]
2.07%
1,06534.4%
[
2.0%
-
2.5%
]
2.17%
1,19644.1%
[
2.0%
-
2.5%
]
2.29%
1,61339.4%
[
2.5%
-
3.0%
]
2.68%
78346.7%
[
2.5%
-
3.0%
]
2.88%
80032.2%
[
3.0%
-
3.5%
]
3.14%
54237.2%
[
3.5%
-
4.0%
]
3.56%
47835.1%
[
3.5%
-
4.0%
]
3.72%
1,61350.1%
[
4.0%
-
4.5%
]
4.22%
16640.5%
[
4.5%
-
5.0%
]
4.58%
96133.0%
[
4.5%
-
5.0%
]
4.68%
27850.4%
[
4.5%
-
5.0%
]
4.97%
1,20751.2%
[
5.0%
-
5.5%
]
5.36%
37340.0%
[
5.5%
-
6.0%
]
5.83%
24021.2%
[
6.0%
-
6.5%
]
6.32%
1,37744.2%
[
6.5%
-
7.0%
]
6.59%
1,15444.5%
[
7.0%
-
7.5%
]
7.08%
1,52646.3%
[
9.0%
-
9.5%
]
9.02%
49943.7%
[
9.0%
-
9.5%
]
9.09%
17641.5%
[
10.5%
-
11.0%
]
10.96%
29226.5%
[
13.0%
-
13.5%
]
13.31%
1,58536.7%
[
13.5%
-
14.0%
]
13.91%
2,30137.6%
[
16.5%
-
17.0%
]
16.54%
8,03333.9%
[
19.0%
-
19.5%
]
19.20%
5,72331.9%
[
25.5%
-
26.0%
]
25.93%
8118.8%