Kiowa Married-Couple Family Poverty
COMPARE
Kiowa
Select to Compare
Married-Couple Family Poverty
Kiowa Married-Couple Family Poverty
6.6%
POVERTY | MARRIED-COUPLE FAMILIES
0.0/ 100
METRIC RATING
297th/ 347
METRIC RANK
Kiowa Married-Couple Family Poverty Correlation Chart
The statistical analysis conducted on geographies consisting of 56,003,088 people shows a mild positive correlation between the proportion of Kiowa and poverty level among married-couple families in the United States with a correlation coefficient (R) of 0.339 and weighted average of 6.6%. On average, for every 1% (one percent) increase in Kiowa within a typical geography, there is an increase of 0.22% in poverty level among married-couple families.
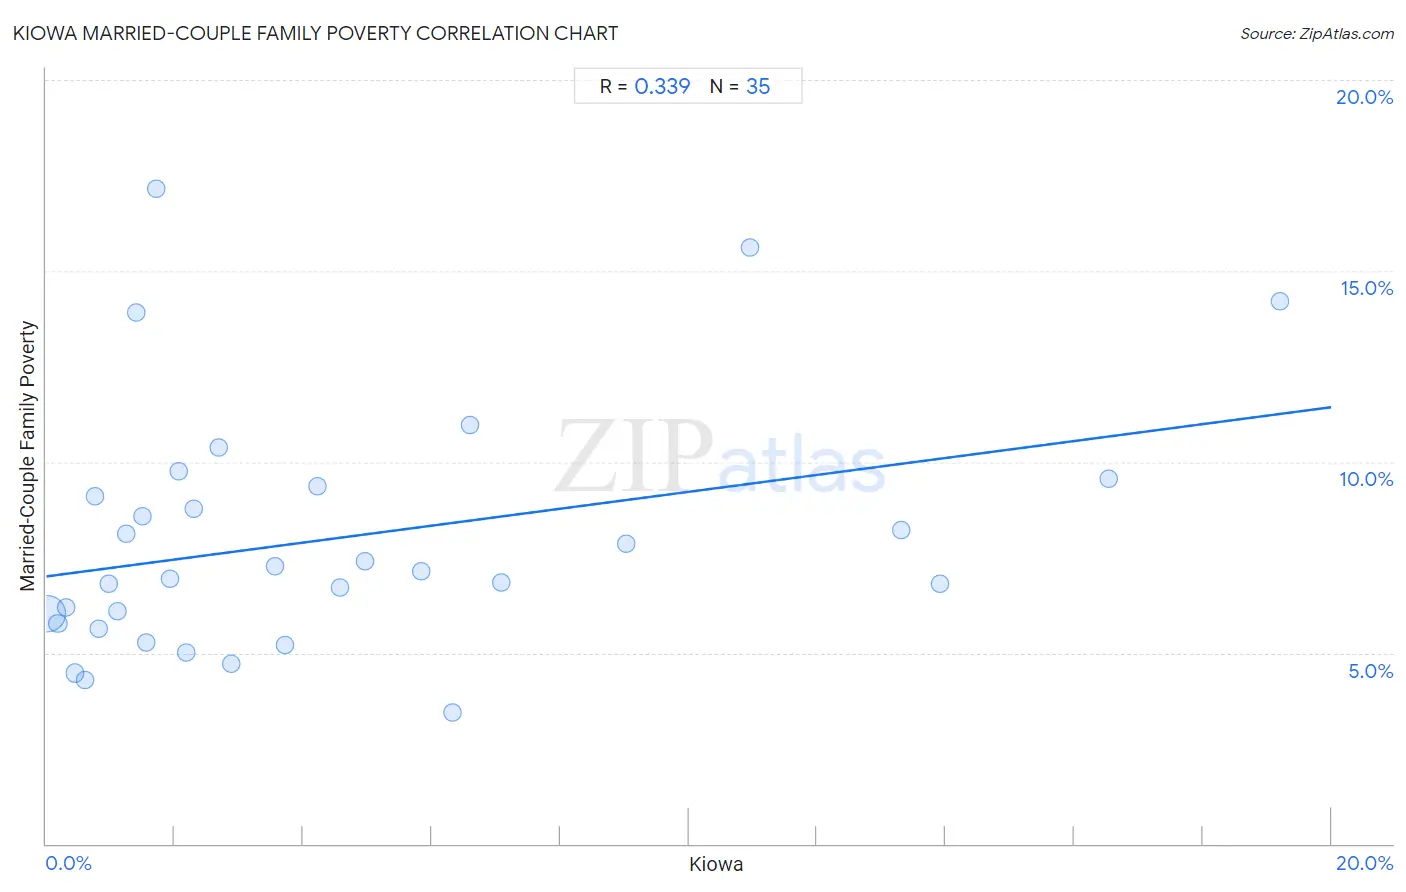
It is essential to understand that the correlation between the percentage of Kiowa and poverty level among married-couple families does not imply a direct cause-and-effect relationship. It remains uncertain whether the presence of Kiowa influences an upward or downward trend in the level of poverty level among married-couple families within an area, or if Kiowa simply ended up residing in those areas with higher or lower levels of poverty level among married-couple families due to other factors.
Demographics Similar to Kiowa by Married-Couple Family Poverty
In terms of married-couple family poverty, the demographic groups most similar to Kiowa are U.S. Virgin Islander (6.6%, a difference of 0.010%), Immigrants from Guyana (6.7%, a difference of 0.070%), Immigrants from Uzbekistan (6.6%, a difference of 0.11%), Bahamian (6.6%, a difference of 0.40%), and Nicaraguan (6.7%, a difference of 0.61%).
| Demographics | Rating | Rank | Married-Couple Family Poverty |
| Immigrants from Barbados | 0.0 /100 | #290 | Tragic 6.5% |
| Belizeans | 0.0 /100 | #291 | Tragic 6.5% |
| Immigrants from Lebanon | 0.0 /100 | #292 | Tragic 6.6% |
| Arapaho | 0.0 /100 | #293 | Tragic 6.6% |
| Bahamians | 0.0 /100 | #294 | Tragic 6.6% |
| Immigrants from Uzbekistan | 0.0 /100 | #295 | Tragic 6.6% |
| U.S. Virgin Islanders | 0.0 /100 | #296 | Tragic 6.6% |
| Kiowa | 0.0 /100 | #297 | Tragic 6.6% |
| Immigrants from Guyana | 0.0 /100 | #298 | Tragic 6.7% |
| Nicaraguans | 0.0 /100 | #299 | Tragic 6.7% |
| Immigrants from Belize | 0.0 /100 | #300 | Tragic 6.7% |
| Central Americans | 0.0 /100 | #301 | Tragic 6.7% |
| Immigrants from Ecuador | 0.0 /100 | #302 | Tragic 6.7% |
| Immigrants from El Salvador | 0.0 /100 | #303 | Tragic 6.8% |
| Cubans | 0.0 /100 | #304 | Tragic 6.8% |
Kiowa Married-Couple Family Poverty Correlation Summary
| Measurement | Kiowa Data | Married-Couple Family Poverty Data |
| Minimum | 0.014% | 3.4% |
| Maximum | 19.2% | 17.1% |
| Range | 19.2% | 13.7% |
| Mean | 4.5% | 8.0% |
| Median | 2.3% | 7.1% |
| Interquartile 25% (IQ1) | 1.1% | 5.8% |
| Interquartile 75% (IQ3) | 6.3% | 9.4% |
| Interquartile Range (IQR) | 5.2% | 3.6% |
| Standard Deviation (Sample) | 4.9% | 3.2% |
| Standard Deviation (Population) | 4.8% | 3.2% |
Correlation Details
| Kiowa Percentile | Sample Size | Married-Couple Family Poverty |
[ 0.0% - 0.5% ] 0.014% | 53,151,563 | 6.0% |
[ 0.0% - 0.5% ] 0.18% | 1,466,752 | 5.8% |
[ 0.0% - 0.5% ] 0.31% | 599,891 | 6.2% |
[ 0.0% - 0.5% ] 0.45% | 335,194 | 4.5% |
[ 0.5% - 1.0% ] 0.60% | 87,487 | 4.3% |
[ 0.5% - 1.0% ] 0.75% | 43,569 | 9.1% |
[ 0.5% - 1.0% ] 0.81% | 110,427 | 5.6% |
[ 0.5% - 1.0% ] 0.98% | 3,059 | 6.8% |
[ 1.0% - 1.5% ] 1.12% | 113,633 | 6.1% |
[ 1.0% - 1.5% ] 1.25% | 9,619 | 8.1% |
[ 1.0% - 1.5% ] 1.40% | 1,713 | 13.9% |
[ 1.0% - 1.5% ] 1.49% | 3,280 | 8.6% |
[ 1.5% - 2.0% ] 1.57% | 21,911 | 5.3% |
[ 1.5% - 2.0% ] 1.70% | 176 | 17.1% |
[ 1.5% - 2.0% ] 1.92% | 22,810 | 6.9% |
[ 2.0% - 2.5% ] 2.07% | 1,065 | 9.7% |
[ 2.0% - 2.5% ] 2.17% | 1,196 | 5.0% |
[ 2.0% - 2.5% ] 2.29% | 1,613 | 8.8% |
[ 2.5% - 3.0% ] 2.68% | 783 | 10.4% |
[ 2.5% - 3.0% ] 2.88% | 800 | 4.7% |
[ 3.5% - 4.0% ] 3.56% | 478 | 7.3% |
[ 3.5% - 4.0% ] 3.72% | 1,263 | 5.2% |
[ 4.0% - 4.5% ] 4.22% | 166 | 9.4% |
[ 4.5% - 5.0% ] 4.58% | 961 | 6.7% |
[ 4.5% - 5.0% ] 4.95% | 949 | 7.4% |
[ 5.5% - 6.0% ] 5.83% | 240 | 7.1% |
[ 6.0% - 6.5% ] 6.32% | 1,377 | 3.4% |
[ 6.5% - 7.0% ] 6.59% | 1,154 | 11.0% |
[ 7.0% - 7.5% ] 7.08% | 1,526 | 6.8% |
[ 9.0% - 9.5% ] 9.02% | 499 | 7.9% |
[ 10.5% - 11.0% ] 10.96% | 292 | 15.6% |
[ 13.0% - 13.5% ] 13.31% | 1,585 | 8.2% |
[ 13.5% - 14.0% ] 13.91% | 2,301 | 6.8% |
[ 16.5% - 17.0% ] 16.54% | 8,033 | 9.6% |
[ 19.0% - 19.5% ] 19.20% | 5,723 | 14.2% |