Kiowa 2 or more Vehicles in Household

COMPARE

Kiowa
Race
Ancestry
AfghanAfricanAlaska NativeAlaskan AthabascanAlbanianAleutAlsatianAmericanApacheArabArapahoArgentineanArmenianAssyrian/Chaldean/SyriacAustralianAustrianBahamianBangladeshiBarbadianBasqueBelgianBelizeanBermudanBhutaneseBlackfeetBolivianBrazilianBritishBritish West IndianBulgarianBurmeseCajunCambodianCanadianCape VerdeanCarpatho RusynCelticCentral AmericanCentral American IndianCherokeeCheyenneChickasawChileanChineseChippewaChoctawColombianColvilleComancheCosta RicanCreeCreekCroatianCrowCubanCypriotCzechCzechoslovakianDanishDelawareDominicanDutchDutch West IndianEastern EuropeanEcuadorianEgyptianEnglishEstonianEthiopianEuropeanFijianFilipinoFinnishFrenchFrench American IndianFrench CanadianGermanGerman RussianGhanaianGreekGuamanian/ChamorroGuatemalanGuyaneseHaitianHmongHonduranHopiHoumaHungarianIcelanderIndian (Asian)IndonesianInupiatIranianIraqiIrishIroquoisIsraeliItalianJamaicanJapaneseJordanianKenyanKiowaKoreanLaotianLatvianLebaneseLiberianLithuanianLumbeeLuxembourgerMacedonianMalaysianMalteseMarshalleseMenomineeMexicanMexican American IndianMongolianMoroccanNative HawaiianNavajoNepaleseNew ZealanderNicaraguanNigerianNorthern EuropeanNorwegianOkinawanOsageOttawaPaiutePakistaniPalestinianPanamanianParaguayanPennsylvania GermanPeruvianPimaPolishPortuguesePotawatomiPuebloPuerto RicanPuget Sound SalishRomanianRussianSalvadoranSamoanScandinavianScotch-IrishScottishSeminoleSenegaleseSerbianShoshoneSierra LeoneanSiouxSlavicSlovakSloveneSomaliSouth AfricanSouth AmericanSouth American IndianSoviet UnionSpaniardSpanishSpanish AmericanSpanish American IndianSri LankanSubsaharan AfricanSudaneseSwedishSwissSyrianTaiwaneseThaiTlingit-HaidaTohono O'OdhamTonganTrinidadian and TobagonianTsimshianTurkishU.S. Virgin IslanderUgandanUkrainianUruguayanUteVenezuelanVietnameseWelshWest IndianYakamaYaquiYugoslavianYumanYup'ikZimbabwean
Immigration
NonimmigrantsImmigrantsAfghanistanAfricaAlbaniaArgentinaArmeniaAsiaAustraliaAustriaBahamasBangladeshBarbadosBelarusBelgiumBelizeBoliviaBosnia and HerzegovinaBrazilBulgariaBurma/MyanmarCabo VerdeCambodiaCameroonCanadaCaribbeanCentral AmericaChileChinaColombiaCongoCosta RicaCroatiaCubaCzechoslovakiaDenmarkDominicaDominican RepublicEastern AfricaEastern AsiaEastern EuropeEcuadorEgyptEl SalvadorEnglandEritreaEthiopiaEuropeFijiFranceGermanyGhanaGreeceGrenadaGuatemalaGuyanaHaitiHondurasHong KongHungaryIndiaIndonesiaIranIraqIrelandIsraelItalyJamaicaJapanJordanKazakhstanKenyaKoreaKuwaitLaosLatin AmericaLatviaLebanonLiberiaLithuaniaMalaysiaMexicoMicronesiaMiddle AfricaMoldovaMoroccoNepalNetherlandsNicaraguaNigeriaNorth AmericaNorth MacedoniaNorthern AfricaNorthern EuropeNorwayOceaniaPakistanPanamaPeruPhilippinesPolandPortugalRomaniaRussiaSaudi ArabiaScotlandSenegalSerbiaSierra LeoneSingaporeSomaliaSouth AfricaSouth AmericaSouth Central AsiaSouth Eastern AsiaSouthern EuropeSpainSri LankaSt. Vincent and the GrenadinesSudanSwedenSwitzerlandSyriaTaiwanThailandTrinidad and TobagoTurkeyUgandaUkraineUruguayUzbekistanVenezuelaVietnamWest IndiesWestern AfricaWestern AsiaWestern EuropeYemenZaireZimbabweAzores
Select to Compare
Race
Ancestry
AfghanAfricanAlaska NativeAlaskan AthabascanAlbanianAleutAlsatianAmericanApacheArabArapahoArgentineanArmenianAssyrian/Chaldean/SyriacAustralianAustrianBahamianBangladeshiBarbadianBasqueBelgianBelizeanBermudanBhutaneseBlackfeetBolivianBrazilianBritishBritish West IndianBulgarianBurmeseCajunCambodianCanadianCape VerdeanCarpatho RusynCelticCentral AmericanCentral American IndianCherokeeCheyenneChickasawChileanChineseChippewaChoctawColombianColvilleComancheCosta RicanCreeCreekCroatianCrowCubanCypriotCzechCzechoslovakianDanishDelawareDominicanDutchDutch West IndianEastern EuropeanEcuadorianEgyptianEnglishEstonianEthiopianEuropeanFijianFilipinoFinnishFrenchFrench American IndianFrench CanadianGermanGerman RussianGhanaianGreekGuamanian/ChamorroGuatemalanGuyaneseHaitianHmongHonduranHopiHoumaHungarianIcelanderIndian (Asian)IndonesianInupiatIranianIraqiIrishIroquoisIsraeliItalianJamaicanJapaneseJordanianKenyanKoreanLaotianLatvianLebaneseLiberianLithuanianLumbeeLuxembourgerMacedonianMalaysianMalteseMarshalleseMenomineeMexicanMexican American IndianMongolianMoroccanNative HawaiianNavajoNepaleseNew ZealanderNicaraguanNigerianNorthern EuropeanNorwegianOkinawanOsageOttawaPaiutePakistaniPalestinianPanamanianParaguayanPennsylvania GermanPeruvianPimaPolishPortuguesePotawatomiPuebloPuerto RicanPuget Sound SalishRomanianRussianSalvadoranSamoanScandinavianScotch-IrishScottishSeminoleSenegaleseSerbianShoshoneSierra LeoneanSiouxSlavicSlovakSloveneSomaliSouth AfricanSouth AmericanSouth American IndianSoviet UnionSpaniardSpanishSpanish AmericanSpanish American IndianSri LankanSubsaharan AfricanSudaneseSwedishSwissSyrianTaiwaneseThaiTlingit-HaidaTohono O'OdhamTonganTrinidadian and TobagonianTsimshianTurkishU.S. Virgin IslanderUgandanUkrainianUruguayanUteVenezuelanVietnameseWelshWest IndianYakamaYaquiYugoslavianYumanYup'ikZimbabwean
Immigration
NonimmigrantsImmigrantsAfghanistanAfricaAlbaniaArgentinaArmeniaAsiaAustraliaAustriaBahamasBangladeshBarbadosBelarusBelgiumBelizeBoliviaBosnia and HerzegovinaBrazilBulgariaBurma/MyanmarCabo VerdeCambodiaCameroonCanadaCaribbeanCentral AmericaChileChinaColombiaCongoCosta RicaCroatiaCubaCzechoslovakiaDenmarkDominicaDominican RepublicEastern AfricaEastern AsiaEastern EuropeEcuadorEgyptEl SalvadorEnglandEritreaEthiopiaEuropeFijiFranceGermanyGhanaGreeceGrenadaGuatemalaGuyanaHaitiHondurasHong KongHungaryIndiaIndonesiaIranIraqIrelandIsraelItalyJamaicaJapanJordanKazakhstanKenyaKoreaKuwaitLaosLatin AmericaLatviaLebanonLiberiaLithuaniaMalaysiaMexicoMicronesiaMiddle AfricaMoldovaMoroccoNepalNetherlandsNicaraguaNigeriaNorth AmericaNorth MacedoniaNorthern AfricaNorthern EuropeNorwayOceaniaPakistanPanamaPeruPhilippinesPolandPortugalRomaniaRussiaSaudi ArabiaScotlandSenegalSerbiaSierra LeoneSingaporeSomaliaSouth AfricaSouth AmericaSouth Central AsiaSouth Eastern AsiaSouthern EuropeSpainSri LankaSt. Vincent and the GrenadinesSudanSwedenSwitzerlandSyriaTaiwanThailandTrinidad and TobagoTurkeyUgandaUkraineUruguayUzbekistanVenezuelaVietnamWest IndiesWestern AfricaWestern AsiaWestern EuropeYemenZaireZimbabweAzores
2 or more Vehicles in Household
Income
Poverty
Unemployment
Labor Participation
Family Structure
Vehicle Availability
Education Level
Disability

Kiowa 2 or more Vehicles in Household
Tragic

53.9%
2+ VEHICLES AVAILABLE
6.2/ 100
METRIC RATING
222nd/ 347
METRIC RANK

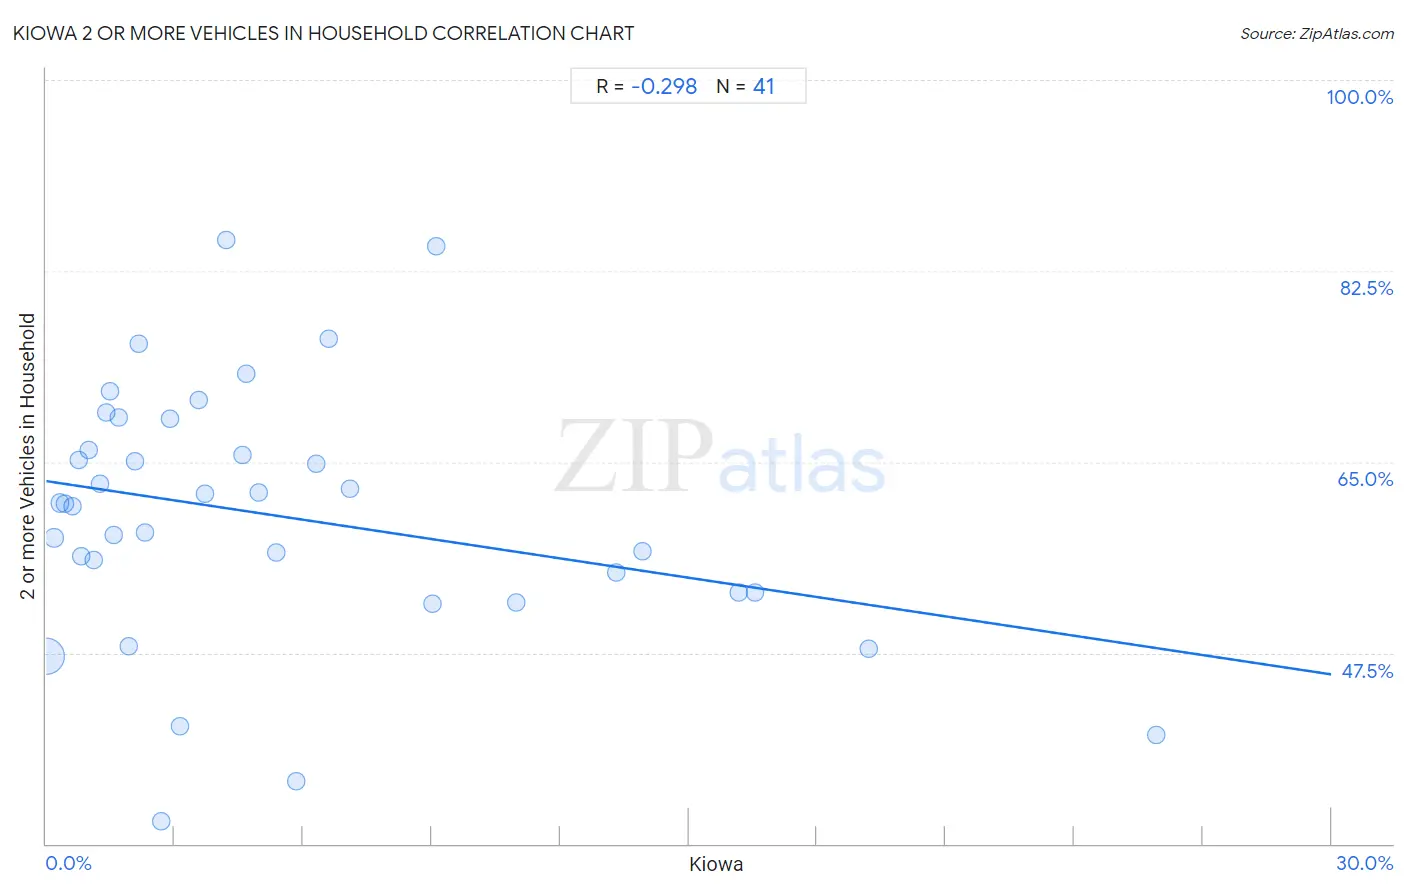
Kiowa 2 or more Vehicles in Household Correlation Chart

The statistical analysis conducted on geographies consisting of 56,099,396 people shows a weak negative correlation between the proportion of Kiowa and percentage of households with 2 or more vehicles available in the United States with a correlation coefficient (R) of -0.298 and weighted average of 53.9%. On average, for every 1% (one percent) increase in Kiowa within a typical geography, there is a decrease of 0.59% in percentage of households with 2 or more vehicles available.
Kiowa 2 or more Vehicles in Household
It is essential to understand that the correlation between the percentage of Kiowa and percentage of households with 2 or more vehicles available does not imply a direct cause-and-effect relationship. It remains uncertain whether the presence of Kiowa influences an upward or downward trend in the level of percentage of households with 2 or more vehicles available within an area, or if Kiowa simply ended up residing in those areas with higher or lower levels of percentage of households with 2 or more vehicles available due to other factors.

Demographics Similar to Kiowa by 2 or more Vehicles in Household

In terms of 2 or more vehicles in household, the demographic groups most similar to Kiowa are Immigrants from Singapore (53.9%, a difference of 0.010%), Taiwanese (53.9%, a difference of 0.030%), South American Indian (53.9%, a difference of 0.050%), Immigrants from Argentina (53.9%, a difference of 0.11%), and Immigrants from Bosnia and Herzegovina (53.8%, a difference of 0.13%).
DemographicsRating | Rank2 or more Vehicles in Household
Aleuts
9.3
/100
|
#215
Tragic
54.1%
Immigrants from Western Asia
9.3
/100
|
#216
Tragic
54.1%
Immigrants from Burma/Myanmar
7.1
/100
|
#217
Tragic
53.9%
Immigrants from Argentina
6.8
/100
|
#218
Tragic
53.9%
South American Indians
6.5
/100
|
#219
Tragic
53.9%
Taiwanese
6.3
/100
|
#220
Tragic
53.9%
Immigrants from Singapore
6.3
/100
|
#221
Tragic
53.9%
Kiowa
6.2
/100
|
#222
Tragic
53.9%
Immigrants from Bosnia and Herzegovina
5.5
/100
|
#223
Tragic
53.8%
Brazilians
5.3
/100
|
#224
Tragic
53.8%
Immigrants from Egypt
5.2
/100
|
#225
Tragic
53.8%
Immigrants from Eastern Africa
5.1
/100
|
#226
Tragic
53.7%
Sudanese
4.1
/100
|
#227
Tragic
53.6%
Alaska Natives
3.9
/100
|
#228
Tragic
53.6%
Immigrants from Turkey
3.8
/100
|
#229
Tragic
53.6%

Kiowa 2 or more Vehicles in Household Correlation Summary

MeasurementKiowa Data2 or more Vehicles in Household Data
Minimum0.014%32.0%
Maximum25.9%85.3%
Range25.9%53.2%
Mean5.4%60.1%
Median3.1%61.2%
Interquartile 25% (IQ1)1.3%53.1%
Interquartile 75% (IQ3)6.8%67.5%
Interquartile Range (IQR)5.5%14.5%
Standard Deviation (Sample)5.9%11.7%
Standard Deviation (Population)5.9%11.6%

Correlation Details

Kiowa PercentileSample Size2 or more Vehicles in Household
[
0.0%
-
0.5%
]
0.014%
53,191,05447.2%
[
0.0%
-
0.5%
]
0.18%
1,500,87058.0%
[
0.0%
-
0.5%
]
0.31%
603,47861.2%
[
0.0%
-
0.5%
]
0.45%
340,72361.2%
[
0.5%
-
1.0%
]
0.60%
91,76361.0%
[
0.5%
-
1.0%
]
0.75%
43,56965.2%
[
0.5%
-
1.0%
]
0.82%
111,87756.3%
[
0.5%
-
1.0%
]
0.98%
3,05966.1%
[
1.0%
-
1.5%
]
1.11%
117,25356.0%
[
1.0%
-
1.5%
]
1.25%
9,93563.0%
[
1.0%
-
1.5%
]
1.40%
1,71369.5%
[
1.0%
-
1.5%
]
1.47%
4,74771.5%
[
1.5%
-
2.0%
]
1.57%
21,91158.3%
[
1.5%
-
2.0%
]
1.70%
17669.0%
[
1.5%
-
2.0%
]
1.92%
22,81048.1%
[
2.0%
-
2.5%
]
2.07%
1,06565.0%
[
2.0%
-
2.5%
]
2.17%
1,19675.8%
[
2.0%
-
2.5%
]
2.29%
1,61358.6%
[
2.5%
-
3.0%
]
2.68%
78332.0%
[
2.5%
-
3.0%
]
2.88%
80069.0%
[
3.0%
-
3.5%
]
3.14%
54240.8%
[
3.5%
-
4.0%
]
3.56%
47870.7%
[
3.5%
-
4.0%
]
3.72%
1,61362.1%
[
4.0%
-
4.5%
]
4.22%
16685.3%
[
4.5%
-
5.0%
]
4.58%
96165.6%
[
4.5%
-
5.0%
]
4.68%
27873.1%
[
4.5%
-
5.0%
]
4.97%
1,20762.2%
[
5.0%
-
5.5%
]
5.36%
37356.7%
[
5.5%
-
6.0%
]
5.83%
24035.7%
[
6.0%
-
6.5%
]
6.32%
1,37764.8%
[
6.5%
-
7.0%
]
6.59%
1,15476.3%
[
7.0%
-
7.5%
]
7.08%
1,52662.5%
[
9.0%
-
9.5%
]
9.02%
49952.0%
[
9.0%
-
9.5%
]
9.09%
17684.8%
[
10.5%
-
11.0%
]
10.96%
29252.1%
[
13.0%
-
13.5%
]
13.31%
1,58554.9%
[
13.5%
-
14.0%
]
13.91%
2,30156.8%
[
16.0%
-
16.5%
]
16.16%
39653.0%
[
16.5%
-
17.0%
]
16.54%
8,03353.1%
[
19.0%
-
19.5%
]
19.20%
5,72347.9%
[
25.5%
-
26.0%
]
25.93%
8140.0%