Kiowa GED/Equivalency
COMPARE
Kiowa
Select to Compare
GED/Equivalency
Kiowa GED/Equivalency
83.1%
GED/EQUIVALENCY
0.2/ 100
METRIC RATING
266th/ 347
METRIC RANK
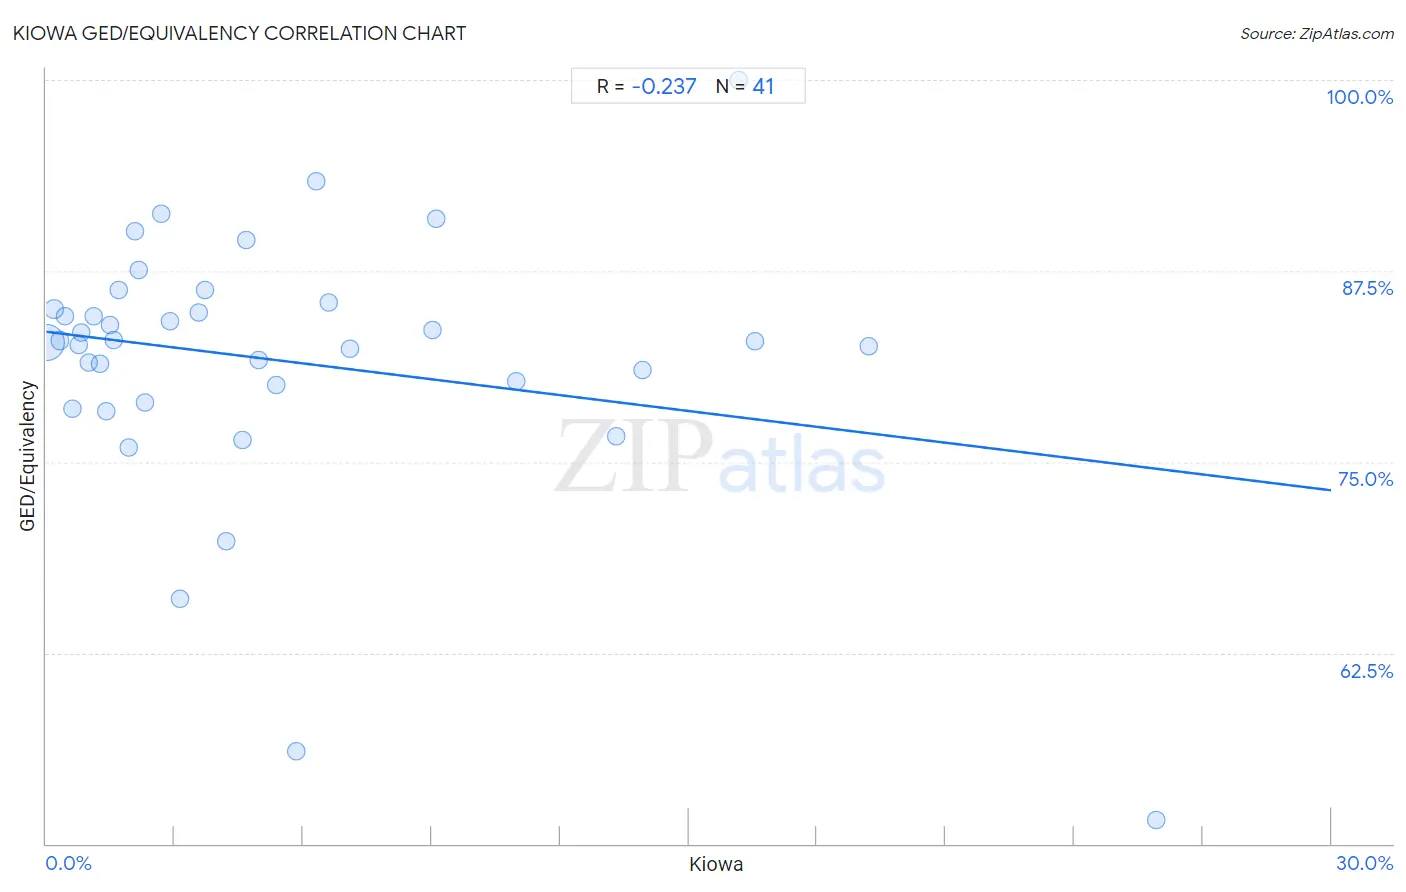
Kiowa GED/Equivalency Correlation Chart
The statistical analysis conducted on geographies consisting of 56,101,840 people shows a weak negative correlation between the proportion of Kiowa and percentage of population with at least ged/equivalency education in the United States with a correlation coefficient (R) of -0.237 and weighted average of 83.1%. On average, for every 1% (one percent) increase in Kiowa within a typical geography, there is a decrease of 0.35% in percentage of population with at least ged/equivalency education.
It is essential to understand that the correlation between the percentage of Kiowa and percentage of population with at least ged/equivalency education does not imply a direct cause-and-effect relationship. It remains uncertain whether the presence of Kiowa influences an upward or downward trend in the level of percentage of population with at least ged/equivalency education within an area, or if Kiowa simply ended up residing in those areas with higher or lower levels of percentage of population with at least ged/equivalency education due to other factors.
Demographics Similar to Kiowa by GED/Equivalency
In terms of ged/equivalency, the demographic groups most similar to Kiowa are Bangladeshi (83.1%, a difference of 0.010%), West Indian (83.1%, a difference of 0.010%), Trinidadian and Tobagonian (83.0%, a difference of 0.020%), Immigrants from Congo (83.1%, a difference of 0.030%), and Inupiat (83.1%, a difference of 0.040%).
| Demographics | Rating | Rank | GED/Equivalency |
| Immigrants from Vietnam | 0.3 /100 | #259 | Tragic 83.2% |
| Choctaw | 0.3 /100 | #260 | Tragic 83.1% |
| Inupiat | 0.2 /100 | #261 | Tragic 83.1% |
| Immigrants from Armenia | 0.2 /100 | #262 | Tragic 83.1% |
| Immigrants from Congo | 0.2 /100 | #263 | Tragic 83.1% |
| Bangladeshis | 0.2 /100 | #264 | Tragic 83.1% |
| West Indians | 0.2 /100 | #265 | Tragic 83.1% |
| Kiowa | 0.2 /100 | #266 | Tragic 83.1% |
| Trinidadians and Tobagonians | 0.2 /100 | #267 | Tragic 83.0% |
| Immigrants from Burma/Myanmar | 0.2 /100 | #268 | Tragic 83.0% |
| Hopi | 0.2 /100 | #269 | Tragic 83.0% |
| Immigrants from Jamaica | 0.2 /100 | #270 | Tragic 82.9% |
| U.S. Virgin Islanders | 0.2 /100 | #271 | Tragic 82.9% |
| Barbadians | 0.1 /100 | #272 | Tragic 82.9% |
| Pennsylvania Germans | 0.1 /100 | #273 | Tragic 82.9% |
Kiowa GED/Equivalency Correlation Summary
| Measurement | Kiowa Data | GED/Equivalency Data |
| Minimum | 0.014% | 51.6% |
| Maximum | 25.9% | 100.0% |
| Range | 25.9% | 48.4% |
| Mean | 5.4% | 81.7% |
| Median | 3.1% | 82.9% |
| Interquartile 25% (IQ1) | 1.3% | 79.5% |
| Interquartile 75% (IQ3) | 6.8% | 85.2% |
| Interquartile Range (IQR) | 5.5% | 5.8% |
| Standard Deviation (Sample) | 5.9% | 8.7% |
| Standard Deviation (Population) | 5.9% | 8.6% |
Correlation Details
| Kiowa Percentile | Sample Size | GED/Equivalency |
[ 0.0% - 0.5% ] 0.014% | 53,191,054 | 82.8% |
[ 0.0% - 0.5% ] 0.18% | 1,500,870 | 85.0% |
[ 0.0% - 0.5% ] 0.31% | 603,478 | 82.9% |
[ 0.0% - 0.5% ] 0.45% | 341,984 | 84.6% |
[ 0.5% - 1.0% ] 0.60% | 91,763 | 78.4% |
[ 0.5% - 1.0% ] 0.75% | 44,752 | 82.6% |
[ 0.5% - 1.0% ] 0.82% | 111,877 | 83.5% |
[ 0.5% - 1.0% ] 0.98% | 3,059 | 81.5% |
[ 1.0% - 1.5% ] 1.11% | 117,253 | 84.5% |
[ 1.0% - 1.5% ] 1.25% | 9,935 | 81.4% |
[ 1.0% - 1.5% ] 1.40% | 1,713 | 78.3% |
[ 1.0% - 1.5% ] 1.47% | 4,747 | 84.0% |
[ 1.5% - 2.0% ] 1.57% | 21,911 | 83.0% |
[ 1.5% - 2.0% ] 1.70% | 176 | 86.2% |
[ 1.5% - 2.0% ] 1.92% | 22,810 | 76.0% |
[ 2.0% - 2.5% ] 2.07% | 1,065 | 90.1% |
[ 2.0% - 2.5% ] 2.17% | 1,196 | 87.6% |
[ 2.0% - 2.5% ] 2.29% | 1,613 | 78.9% |
[ 2.5% - 3.0% ] 2.68% | 783 | 91.2% |
[ 2.5% - 3.0% ] 2.88% | 800 | 84.2% |
[ 3.0% - 3.5% ] 3.14% | 542 | 66.0% |
[ 3.5% - 4.0% ] 3.56% | 478 | 84.7% |
[ 3.5% - 4.0% ] 3.72% | 1,613 | 86.3% |
[ 4.0% - 4.5% ] 4.22% | 166 | 69.8% |
[ 4.5% - 5.0% ] 4.58% | 961 | 76.4% |
[ 4.5% - 5.0% ] 4.68% | 278 | 89.5% |
[ 4.5% - 5.0% ] 4.97% | 1,207 | 81.7% |
[ 5.0% - 5.5% ] 5.36% | 373 | 80.0% |
[ 5.5% - 6.0% ] 5.83% | 240 | 56.1% |
[ 6.0% - 6.5% ] 6.32% | 1,377 | 93.4% |
[ 6.5% - 7.0% ] 6.59% | 1,154 | 85.4% |
[ 7.0% - 7.5% ] 7.08% | 1,526 | 82.4% |
[ 9.0% - 9.5% ] 9.02% | 499 | 83.6% |
[ 9.0% - 9.5% ] 9.09% | 176 | 90.9% |
[ 10.5% - 11.0% ] 10.96% | 292 | 80.2% |
[ 13.0% - 13.5% ] 13.31% | 1,585 | 76.7% |
[ 13.5% - 14.0% ] 13.91% | 2,301 | 81.0% |
[ 16.0% - 16.5% ] 16.16% | 396 | 100.0% |
[ 16.5% - 17.0% ] 16.54% | 8,033 | 82.9% |
[ 19.0% - 19.5% ] 19.20% | 5,723 | 82.6% |
[ 25.5% - 26.0% ] 25.93% | 81 | 51.6% |