Kiowa Married-couple Households

COMPARE

Kiowa
Race
Ancestry
AfghanAfricanAlaska NativeAlaskan AthabascanAlbanianAleutAlsatianAmericanApacheArabArapahoArgentineanArmenianAssyrian/Chaldean/SyriacAustralianAustrianBahamianBangladeshiBarbadianBasqueBelgianBelizeanBermudanBhutaneseBlackfeetBolivianBrazilianBritishBritish West IndianBulgarianBurmeseCajunCambodianCanadianCape VerdeanCarpatho RusynCelticCentral AmericanCentral American IndianCherokeeCheyenneChickasawChileanChineseChippewaChoctawColombianColvilleComancheCosta RicanCreeCreekCroatianCrowCubanCypriotCzechCzechoslovakianDanishDelawareDominicanDutchDutch West IndianEastern EuropeanEcuadorianEgyptianEnglishEstonianEthiopianEuropeanFijianFilipinoFinnishFrenchFrench American IndianFrench CanadianGermanGerman RussianGhanaianGreekGuamanian/ChamorroGuatemalanGuyaneseHaitianHmongHonduranHopiHoumaHungarianIcelanderIndian (Asian)IndonesianInupiatIranianIraqiIrishIroquoisIsraeliItalianJamaicanJapaneseJordanianKenyanKiowaKoreanLaotianLatvianLebaneseLiberianLithuanianLumbeeLuxembourgerMacedonianMalaysianMalteseMarshalleseMenomineeMexicanMexican American IndianMongolianMoroccanNative HawaiianNavajoNepaleseNew ZealanderNicaraguanNigerianNorthern EuropeanNorwegianOkinawanOsageOttawaPaiutePakistaniPalestinianPanamanianParaguayanPennsylvania GermanPeruvianPimaPolishPortuguesePotawatomiPuebloPuerto RicanPuget Sound SalishRomanianRussianSalvadoranSamoanScandinavianScotch-IrishScottishSeminoleSenegaleseSerbianShoshoneSierra LeoneanSiouxSlavicSlovakSloveneSomaliSouth AfricanSouth AmericanSouth American IndianSoviet UnionSpaniardSpanishSpanish AmericanSpanish American IndianSri LankanSubsaharan AfricanSudaneseSwedishSwissSyrianTaiwaneseThaiTlingit-HaidaTohono O'OdhamTonganTrinidadian and TobagonianTsimshianTurkishU.S. Virgin IslanderUgandanUkrainianUruguayanUteVenezuelanVietnameseWelshWest IndianYakamaYaquiYugoslavianYumanYup'ikZimbabwean
Immigration
NonimmigrantsImmigrantsAfghanistanAfricaAlbaniaArgentinaArmeniaAsiaAustraliaAustriaBahamasBangladeshBarbadosBelarusBelgiumBelizeBoliviaBosnia and HerzegovinaBrazilBulgariaBurma/MyanmarCabo VerdeCambodiaCameroonCanadaCaribbeanCentral AmericaChileChinaColombiaCongoCosta RicaCroatiaCubaCzechoslovakiaDenmarkDominicaDominican RepublicEastern AfricaEastern AsiaEastern EuropeEcuadorEgyptEl SalvadorEnglandEritreaEthiopiaEuropeFijiFranceGermanyGhanaGreeceGrenadaGuatemalaGuyanaHaitiHondurasHong KongHungaryIndiaIndonesiaIranIraqIrelandIsraelItalyJamaicaJapanJordanKazakhstanKenyaKoreaKuwaitLaosLatin AmericaLatviaLebanonLiberiaLithuaniaMalaysiaMexicoMicronesiaMiddle AfricaMoldovaMoroccoNepalNetherlandsNicaraguaNigeriaNorth AmericaNorth MacedoniaNorthern AfricaNorthern EuropeNorwayOceaniaPakistanPanamaPeruPhilippinesPolandPortugalRomaniaRussiaSaudi ArabiaScotlandSenegalSerbiaSierra LeoneSingaporeSomaliaSouth AfricaSouth AmericaSouth Central AsiaSouth Eastern AsiaSouthern EuropeSpainSri LankaSt. Vincent and the GrenadinesSudanSwedenSwitzerlandSyriaTaiwanThailandTrinidad and TobagoTurkeyUgandaUkraineUruguayUzbekistanVenezuelaVietnamWest IndiesWestern AfricaWestern AsiaWestern EuropeYemenZaireZimbabweAzores
Select to Compare
Race
Ancestry
AfghanAfricanAlaska NativeAlaskan AthabascanAlbanianAleutAlsatianAmericanApacheArabArapahoArgentineanArmenianAssyrian/Chaldean/SyriacAustralianAustrianBahamianBangladeshiBarbadianBasqueBelgianBelizeanBermudanBhutaneseBlackfeetBolivianBrazilianBritishBritish West IndianBulgarianBurmeseCajunCambodianCanadianCape VerdeanCarpatho RusynCelticCentral AmericanCentral American IndianCherokeeCheyenneChickasawChileanChineseChippewaChoctawColombianColvilleComancheCosta RicanCreeCreekCroatianCrowCubanCypriotCzechCzechoslovakianDanishDelawareDominicanDutchDutch West IndianEastern EuropeanEcuadorianEgyptianEnglishEstonianEthiopianEuropeanFijianFilipinoFinnishFrenchFrench American IndianFrench CanadianGermanGerman RussianGhanaianGreekGuamanian/ChamorroGuatemalanGuyaneseHaitianHmongHonduranHopiHoumaHungarianIcelanderIndian (Asian)IndonesianInupiatIranianIraqiIrishIroquoisIsraeliItalianJamaicanJapaneseJordanianKenyanKoreanLaotianLatvianLebaneseLiberianLithuanianLumbeeLuxembourgerMacedonianMalaysianMalteseMarshalleseMenomineeMexicanMexican American IndianMongolianMoroccanNative HawaiianNavajoNepaleseNew ZealanderNicaraguanNigerianNorthern EuropeanNorwegianOkinawanOsageOttawaPaiutePakistaniPalestinianPanamanianParaguayanPennsylvania GermanPeruvianPimaPolishPortuguesePotawatomiPuebloPuerto RicanPuget Sound SalishRomanianRussianSalvadoranSamoanScandinavianScotch-IrishScottishSeminoleSenegaleseSerbianShoshoneSierra LeoneanSiouxSlavicSlovakSloveneSomaliSouth AfricanSouth AmericanSouth American IndianSoviet UnionSpaniardSpanishSpanish AmericanSpanish American IndianSri LankanSubsaharan AfricanSudaneseSwedishSwissSyrianTaiwaneseThaiTlingit-HaidaTohono O'OdhamTonganTrinidadian and TobagonianTsimshianTurkishU.S. Virgin IslanderUgandanUkrainianUruguayanUteVenezuelanVietnameseWelshWest IndianYakamaYaquiYugoslavianYumanYup'ikZimbabwean
Immigration
NonimmigrantsImmigrantsAfghanistanAfricaAlbaniaArgentinaArmeniaAsiaAustraliaAustriaBahamasBangladeshBarbadosBelarusBelgiumBelizeBoliviaBosnia and HerzegovinaBrazilBulgariaBurma/MyanmarCabo VerdeCambodiaCameroonCanadaCaribbeanCentral AmericaChileChinaColombiaCongoCosta RicaCroatiaCubaCzechoslovakiaDenmarkDominicaDominican RepublicEastern AfricaEastern AsiaEastern EuropeEcuadorEgyptEl SalvadorEnglandEritreaEthiopiaEuropeFijiFranceGermanyGhanaGreeceGrenadaGuatemalaGuyanaHaitiHondurasHong KongHungaryIndiaIndonesiaIranIraqIrelandIsraelItalyJamaicaJapanJordanKazakhstanKenyaKoreaKuwaitLaosLatin AmericaLatviaLebanonLiberiaLithuaniaMalaysiaMexicoMicronesiaMiddle AfricaMoldovaMoroccoNepalNetherlandsNicaraguaNigeriaNorth AmericaNorth MacedoniaNorthern AfricaNorthern EuropeNorwayOceaniaPakistanPanamaPeruPhilippinesPolandPortugalRomaniaRussiaSaudi ArabiaScotlandSenegalSerbiaSierra LeoneSingaporeSomaliaSouth AfricaSouth AmericaSouth Central AsiaSouth Eastern AsiaSouthern EuropeSpainSri LankaSt. Vincent and the GrenadinesSudanSwedenSwitzerlandSyriaTaiwanThailandTrinidad and TobagoTurkeyUgandaUkraineUruguayUzbekistanVenezuelaVietnamWest IndiesWestern AfricaWestern AsiaWestern EuropeYemenZaireZimbabweAzores
Married-couple Households
Income
Poverty
Unemployment
Labor Participation
Family Structure
Vehicle Availability
Education Level
Disability

Kiowa Married-couple Households
Tragic

42.0%
MARRIED-COUPLE HOUSEHOLDS
0.0/ 100
METRIC RATING
295th/ 347
METRIC RANK

Kiowa Married-couple Households Correlation Chart

The statistical analysis conducted on geographies consisting of 56,098,854 people shows a mild negative correlation between the proportion of Kiowa and percentage of married-couple family households in the United States with a correlation coefficient (R) of -0.301 and weighted average of 42.0%. On average, for every 1% (one percent) increase in Kiowa within a typical geography, there is a decrease of 0.46% in percentage of married-couple family households.
Kiowa Married-couple Households
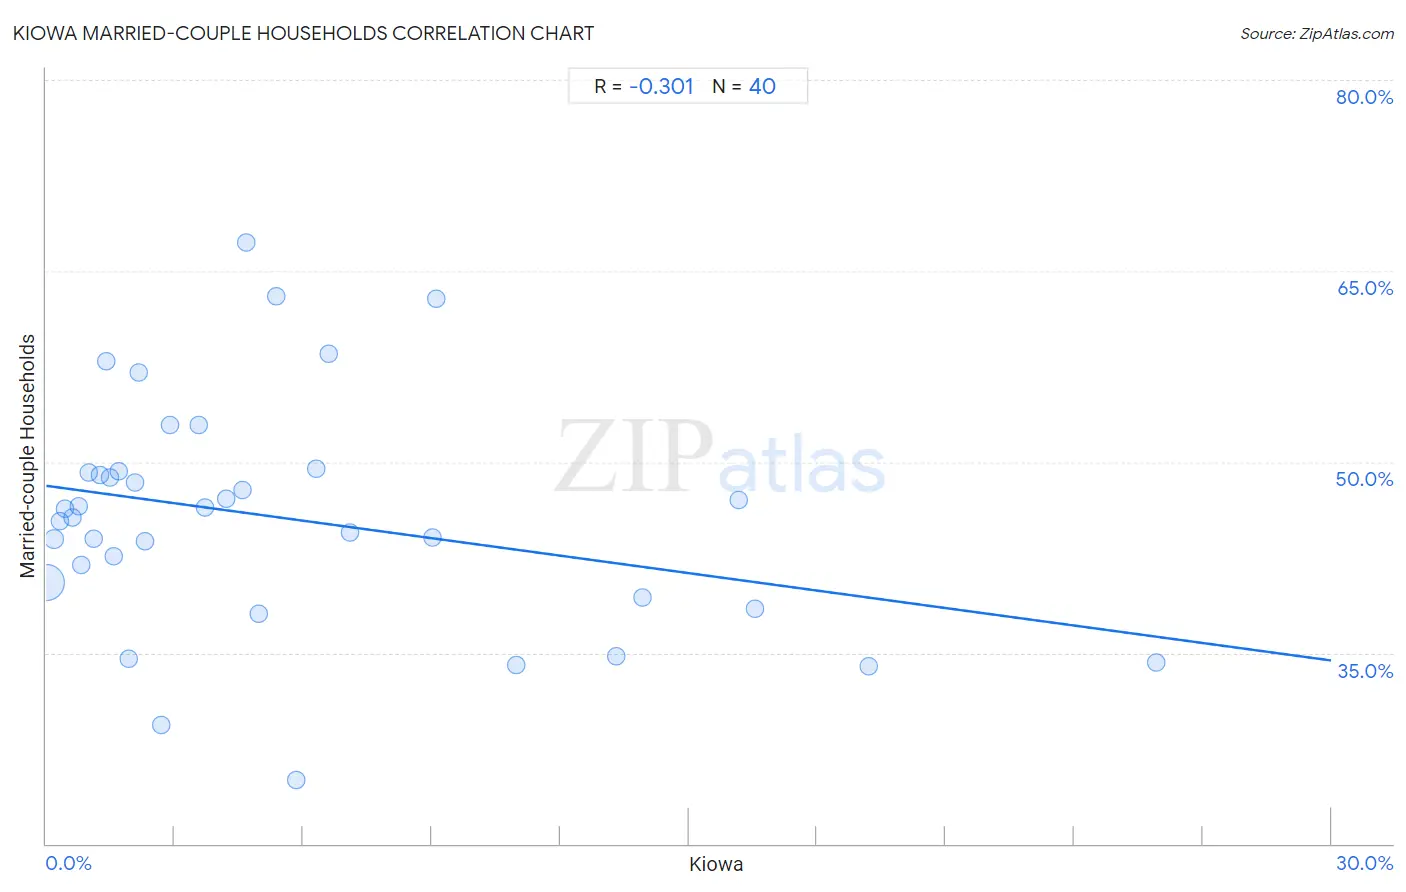
It is essential to understand that the correlation between the percentage of Kiowa and percentage of married-couple family households does not imply a direct cause-and-effect relationship. It remains uncertain whether the presence of Kiowa influences an upward or downward trend in the level of percentage of married-couple family households within an area, or if Kiowa simply ended up residing in those areas with higher or lower levels of percentage of married-couple family households due to other factors.

Demographics Similar to Kiowa by Married-couple Households

In terms of married-couple households, the demographic groups most similar to Kiowa are Menominee (42.0%, a difference of 0.0%), Immigrants from Yemen (42.0%, a difference of 0.0%), Immigrants from Sudan (41.9%, a difference of 0.11%), Indonesian (42.0%, a difference of 0.12%), and Paiute (42.1%, a difference of 0.16%).
DemographicsRating | RankMarried-couple Households
Immigrants from Eritrea
0.0
/100
|
#288
Tragic
42.1%
Sudanese
0.0
/100
|
#289
Tragic
42.1%
Hondurans
0.0
/100
|
#290
Tragic
42.1%
Paiute
0.0
/100
|
#291
Tragic
42.1%
Indonesians
0.0
/100
|
#292
Tragic
42.0%
Menominee
0.0
/100
|
#293
Tragic
42.0%
Immigrants from Yemen
0.0
/100
|
#294
Tragic
42.0%
Kiowa
0.0
/100
|
#295
Tragic
42.0%
Immigrants from Sudan
0.0
/100
|
#296
Tragic
41.9%
Arapaho
0.0
/100
|
#297
Tragic
41.8%
Immigrants from Middle Africa
0.0
/100
|
#298
Tragic
41.8%
Immigrants from Ghana
0.0
/100
|
#299
Tragic
41.8%
Immigrants from Belize
0.0
/100
|
#300
Tragic
41.8%
Immigrants from Bahamas
0.0
/100
|
#301
Tragic
41.7%
Immigrants from Honduras
0.0
/100
|
#302
Tragic
41.6%

Kiowa Married-couple Households Correlation Summary

MeasurementKiowa DataMarried-couple Households Data
Minimum0.014%25.0%
Maximum25.9%67.2%
Range25.9%42.2%
Mean5.4%45.6%
Median3.2%45.9%
Interquartile 25% (IQ1)1.3%39.9%
Interquartile 75% (IQ3)6.8%49.2%
Interquartile Range (IQR)5.5%9.3%
Standard Deviation (Sample)6.0%9.1%
Standard Deviation (Population)5.9%9.0%

Correlation Details

Kiowa PercentileSample SizeMarried-couple Households
[
0.0%
-
0.5%
]
0.014%
53,191,05440.5%
[
0.0%
-
0.5%
]
0.18%
1,500,87043.9%
[
0.0%
-
0.5%
]
0.31%
603,47845.3%
[
0.0%
-
0.5%
]
0.45%
340,72346.3%
[
0.5%
-
1.0%
]
0.60%
91,76345.6%
[
0.5%
-
1.0%
]
0.75%
43,56946.5%
[
0.5%
-
1.0%
]
0.82%
111,87741.9%
[
0.5%
-
1.0%
]
0.98%
3,05949.1%
[
1.0%
-
1.5%
]
1.11%
117,25344.0%
[
1.0%
-
1.5%
]
1.25%
9,93549.0%
[
1.0%
-
1.5%
]
1.40%
1,71357.9%
[
1.0%
-
1.5%
]
1.47%
4,74748.7%
[
1.5%
-
2.0%
]
1.57%
21,91142.6%
[
1.5%
-
2.0%
]
1.70%
17649.3%
[
1.5%
-
2.0%
]
1.92%
22,81034.5%
[
2.0%
-
2.5%
]
2.07%
1,06548.4%
[
2.0%
-
2.5%
]
2.17%
1,19657.0%
[
2.0%
-
2.5%
]
2.29%
1,61343.7%
[
2.5%
-
3.0%
]
2.68%
78329.3%
[
2.5%
-
3.0%
]
2.88%
80052.9%
[
3.5%
-
4.0%
]
3.56%
47852.9%
[
3.5%
-
4.0%
]
3.72%
1,61346.4%
[
4.0%
-
4.5%
]
4.22%
16647.1%
[
4.5%
-
5.0%
]
4.58%
96147.8%
[
4.5%
-
5.0%
]
4.68%
27867.2%
[
4.5%
-
5.0%
]
4.97%
1,20738.1%
[
5.0%
-
5.5%
]
5.36%
37363.0%
[
5.5%
-
6.0%
]
5.83%
24025.0%
[
6.0%
-
6.5%
]
6.32%
1,37749.5%
[
6.5%
-
7.0%
]
6.59%
1,15458.5%
[
7.0%
-
7.5%
]
7.08%
1,52644.4%
[
9.0%
-
9.5%
]
9.02%
49944.1%
[
9.0%
-
9.5%
]
9.09%
17662.9%
[
10.5%
-
11.0%
]
10.96%
29234.0%
[
13.0%
-
13.5%
]
13.31%
1,58534.7%
[
13.5%
-
14.0%
]
13.91%
2,30139.4%
[
16.0%
-
16.5%
]
16.16%
39647.0%
[
16.5%
-
17.0%
]
16.54%
8,03338.5%
[
19.0%
-
19.5%
]
19.20%
5,72334.0%
[
25.5%
-
26.0%
]
25.93%
8134.3%