Maltese vs Blackfeet 4 or more Vehicles in Household
COMPARE
Maltese
Blackfeet
4 or more Vehicles in Household
4 or more Vehicles in Household Comparison
Maltese
Blackfeet
6.7%
4 OR MORE VEHICLES IN HOUSEHOLD
88.4/ 100
METRIC RATING
131st/ 347
METRIC RANK
7.0%
4 OR MORE VEHICLES IN HOUSEHOLD
98.6/ 100
METRIC RATING
103rd/ 347
METRIC RANK
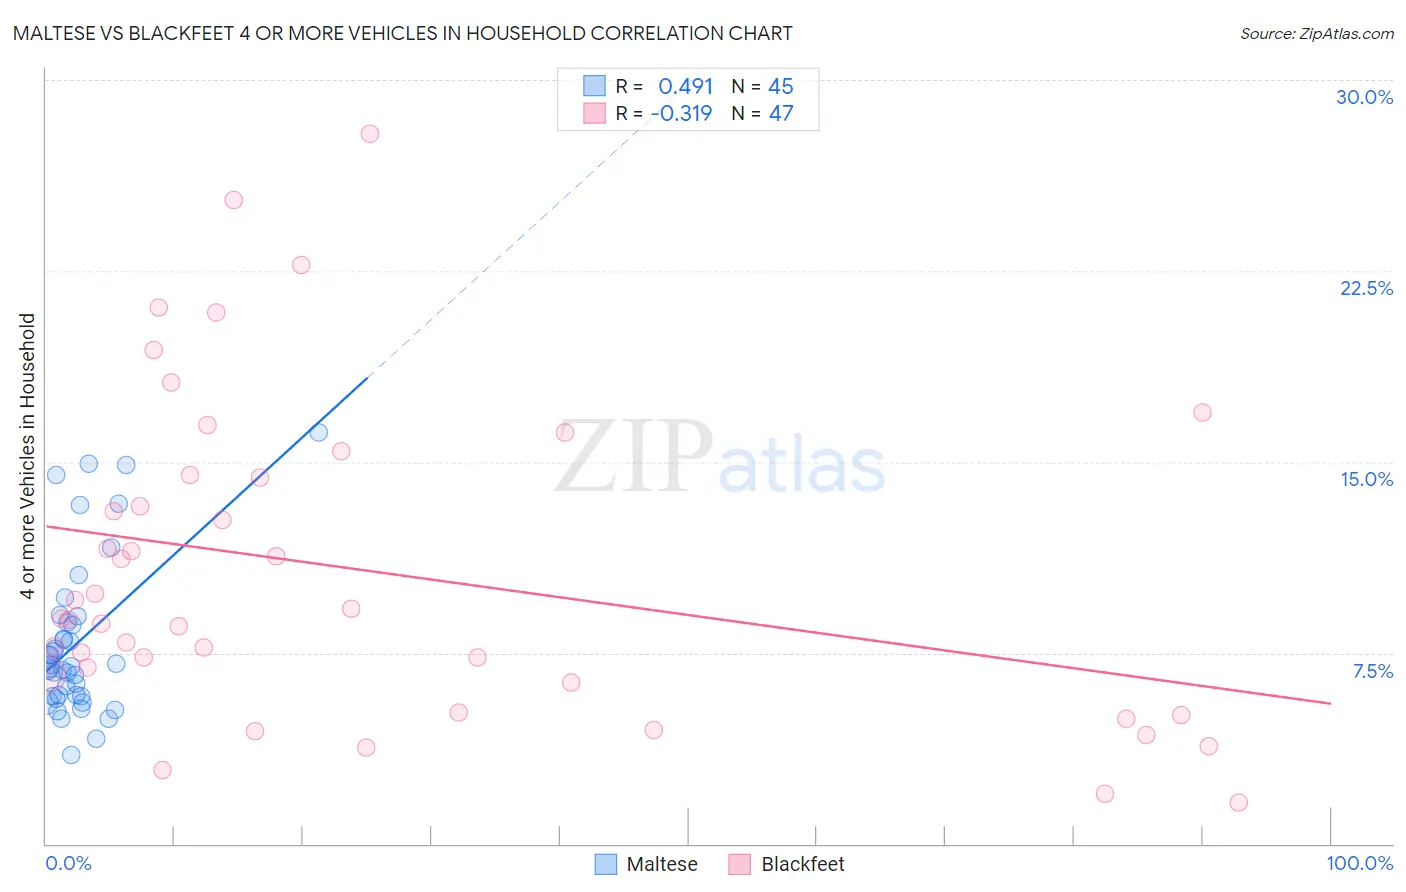
Maltese vs Blackfeet 4 or more Vehicles in Household Correlation Chart
The statistical analysis conducted on geographies consisting of 125,931,665 people shows a moderate positive correlation between the proportion of Maltese and percentage of households with 4 or more vehicles available in the United States with a correlation coefficient (R) of 0.491 and weighted average of 6.7%. Similarly, the statistical analysis conducted on geographies consisting of 308,735,015 people shows a mild negative correlation between the proportion of Blackfeet and percentage of households with 4 or more vehicles available in the United States with a correlation coefficient (R) of -0.319 and weighted average of 7.0%, a difference of 5.4%.
4 or more Vehicles in Household Correlation Summary
| Measurement | Maltese | Blackfeet |
| Minimum | 3.5% | 1.6% |
| Maximum | 16.2% | 27.9% |
| Range | 12.7% | 26.3% |
| Mean | 7.9% | 10.7% |
| Median | 7.0% | 8.8% |
| Interquartile 25% (IQ1) | 5.8% | 6.3% |
| Interquartile 75% (IQ3) | 8.8% | 14.5% |
| Interquartile Range (IQR) | 3.0% | 8.2% |
| Standard Deviation (Sample) | 3.1% | 6.3% |
| Standard Deviation (Population) | 3.1% | 6.2% |
Similar Demographics by 4 or more Vehicles in Household
Demographics Similar to Maltese by 4 or more Vehicles in Household
In terms of 4 or more vehicles in household, the demographic groups most similar to Maltese are Immigrants from Netherlands (6.6%, a difference of 0.14%), Immigrants from Scotland (6.7%, a difference of 0.15%), Armenian (6.6%, a difference of 0.34%), Ottawa (6.6%, a difference of 0.35%), and Tohono O'odham (6.6%, a difference of 0.38%).
| Demographics | Rating | Rank | 4 or more Vehicles in Household |
| Immigrants | Asia | 94.4 /100 | #124 | Exceptional 6.8% |
| Austrians | 94.1 /100 | #125 | Exceptional 6.8% |
| Belgians | 94.1 /100 | #126 | Exceptional 6.8% |
| Immigrants | Korea | 93.8 /100 | #127 | Exceptional 6.8% |
| Immigrants | Bolivia | 92.5 /100 | #128 | Exceptional 6.7% |
| Immigrants | England | 92.0 /100 | #129 | Exceptional 6.7% |
| Immigrants | Scotland | 89.0 /100 | #130 | Excellent 6.7% |
| Maltese | 88.4 /100 | #131 | Excellent 6.7% |
| Immigrants | Netherlands | 87.8 /100 | #132 | Excellent 6.6% |
| Armenians | 86.9 /100 | #133 | Excellent 6.6% |
| Ottawa | 86.9 /100 | #134 | Excellent 6.6% |
| Tohono O'odham | 86.7 /100 | #135 | Excellent 6.6% |
| Luxembourgers | 86.4 /100 | #136 | Excellent 6.6% |
| French Canadians | 85.4 /100 | #137 | Excellent 6.6% |
| Italians | 84.5 /100 | #138 | Excellent 6.6% |
Demographics Similar to Blackfeet by 4 or more Vehicles in Household
In terms of 4 or more vehicles in household, the demographic groups most similar to Blackfeet are Asian (7.0%, a difference of 0.010%), Pakistani (7.0%, a difference of 0.080%), Taiwanese (7.0%, a difference of 0.15%), Seminole (7.0%, a difference of 0.22%), and Hmong (7.0%, a difference of 0.48%).
| Demographics | Rating | Rank | 4 or more Vehicles in Household |
| Central Americans | 99.3 /100 | #96 | Exceptional 7.1% |
| Celtics | 99.1 /100 | #97 | Exceptional 7.1% |
| Irish | 99.0 /100 | #98 | Exceptional 7.1% |
| Seminole | 98.8 /100 | #99 | Exceptional 7.0% |
| Taiwanese | 98.7 /100 | #100 | Exceptional 7.0% |
| Pakistanis | 98.7 /100 | #101 | Exceptional 7.0% |
| Asians | 98.6 /100 | #102 | Exceptional 7.0% |
| Blackfeet | 98.6 /100 | #103 | Exceptional 7.0% |
| Hmong | 98.3 /100 | #104 | Exceptional 7.0% |
| German Russians | 98.3 /100 | #105 | Exceptional 7.0% |
| Guatemalans | 98.1 /100 | #106 | Exceptional 7.0% |
| Nicaraguans | 98.0 /100 | #107 | Exceptional 7.0% |
| French | 97.7 /100 | #108 | Exceptional 6.9% |
| Filipinos | 97.6 /100 | #109 | Exceptional 6.9% |
| Immigrants | Thailand | 97.0 /100 | #110 | Exceptional 6.9% |