South African vs Immigrants from Eastern Europe 4 or more Vehicles in Household
COMPARE
South African
Immigrants from Eastern Europe
4 or more Vehicles in Household
4 or more Vehicles in Household Comparison
South Africans
Immigrants from Eastern Europe
6.2%
4 OR MORE VEHICLES IN HOUSEHOLD
32.2/ 100
METRIC RATING
190th/ 347
METRIC RANK
5.4%
4 OR MORE VEHICLES IN HOUSEHOLD
0.4/ 100
METRIC RATING
278th/ 347
METRIC RANK
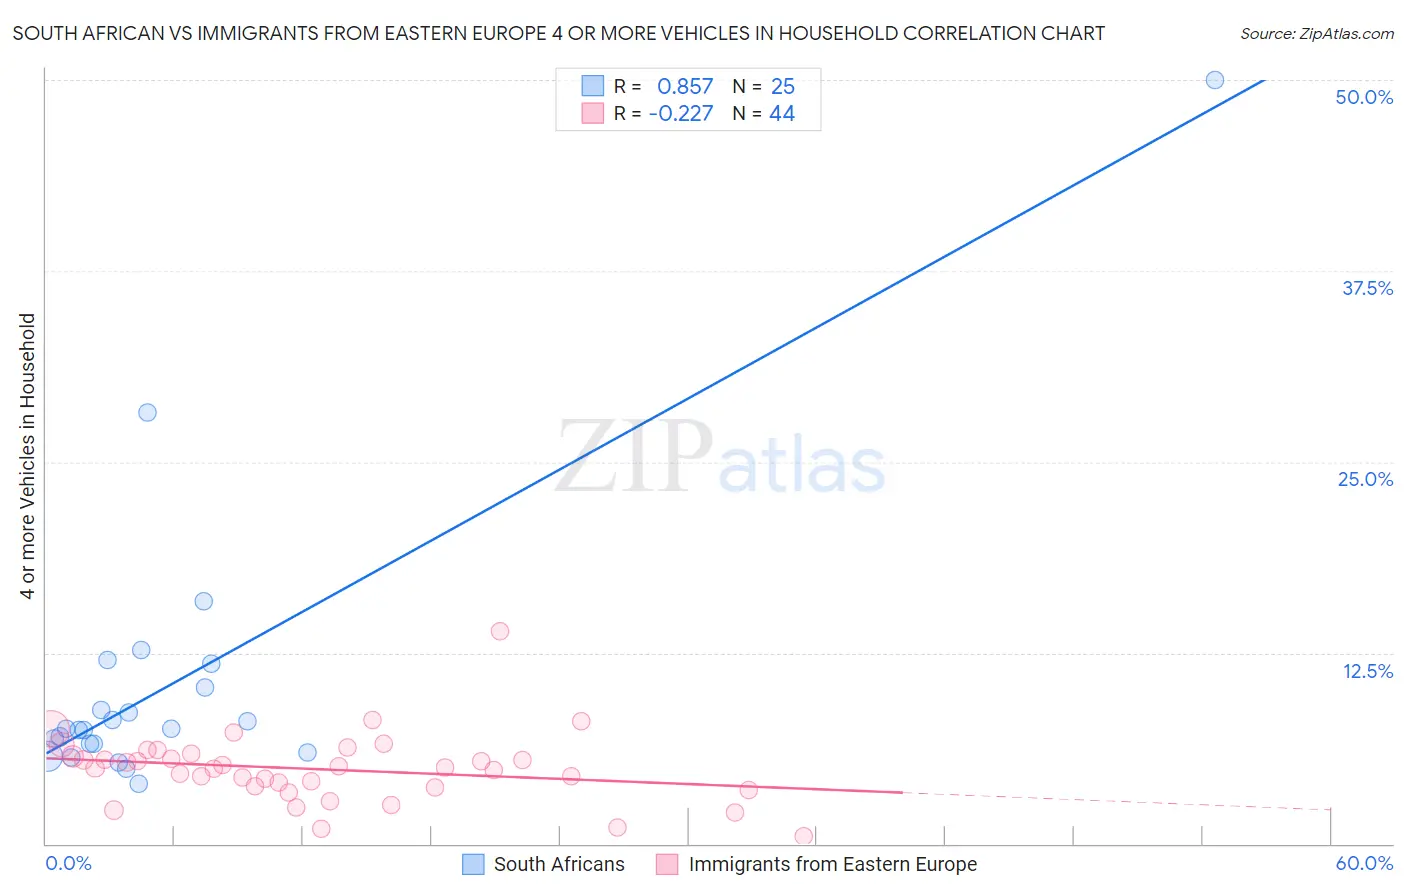
South African vs Immigrants from Eastern Europe 4 or more Vehicles in Household Correlation Chart
The statistical analysis conducted on geographies consisting of 181,747,676 people shows a very strong positive correlation between the proportion of South Africans and percentage of households with 4 or more vehicles available in the United States with a correlation coefficient (R) of 0.857 and weighted average of 6.2%. Similarly, the statistical analysis conducted on geographies consisting of 473,333,841 people shows a weak negative correlation between the proportion of Immigrants from Eastern Europe and percentage of households with 4 or more vehicles available in the United States with a correlation coefficient (R) of -0.227 and weighted average of 5.4%, a difference of 14.2%.
4 or more Vehicles in Household Correlation Summary
| Measurement | South African | Immigrants from Eastern Europe |
| Minimum | 3.9% | 0.50% |
| Maximum | 50.0% | 13.9% |
| Range | 46.1% | 13.4% |
| Mean | 10.5% | 4.9% |
| Median | 7.5% | 5.0% |
| Interquartile 25% (IQ1) | 6.2% | 3.7% |
| Interquartile 75% (IQ3) | 11.0% | 5.8% |
| Interquartile Range (IQR) | 4.8% | 2.1% |
| Standard Deviation (Sample) | 9.6% | 2.3% |
| Standard Deviation (Population) | 9.4% | 2.2% |
Similar Demographics by 4 or more Vehicles in Household
Demographics Similar to South Africans by 4 or more Vehicles in Household
In terms of 4 or more vehicles in household, the demographic groups most similar to South Africans are Immigrants from Eastern Asia (6.2%, a difference of 0.12%), Inupiat (6.2%, a difference of 0.18%), Romanian (6.2%, a difference of 0.19%), Kiowa (6.2%, a difference of 0.29%), and Immigrants from South Africa (6.2%, a difference of 0.36%).
| Demographics | Rating | Rank | 4 or more Vehicles in Household |
| Immigrants | Burma/Myanmar | 37.5 /100 | #183 | Fair 6.2% |
| Iraqis | 37.3 /100 | #184 | Fair 6.2% |
| Thais | 36.9 /100 | #185 | Fair 6.2% |
| Immigrants | Northern Europe | 36.8 /100 | #186 | Fair 6.2% |
| Immigrants | South Africa | 35.4 /100 | #187 | Fair 6.2% |
| Kiowa | 34.7 /100 | #188 | Fair 6.2% |
| Immigrants | Eastern Asia | 33.3 /100 | #189 | Fair 6.2% |
| South Africans | 32.2 /100 | #190 | Fair 6.2% |
| Inupiat | 30.7 /100 | #191 | Fair 6.2% |
| Romanians | 30.7 /100 | #192 | Fair 6.2% |
| Immigrants | Kuwait | 28.0 /100 | #193 | Fair 6.2% |
| Immigrants | Sweden | 27.0 /100 | #194 | Fair 6.2% |
| Argentineans | 27.0 /100 | #195 | Fair 6.2% |
| Tsimshian | 26.4 /100 | #196 | Fair 6.2% |
| Immigrants | Sri Lanka | 23.7 /100 | #197 | Fair 6.1% |
Demographics Similar to Immigrants from Eastern Europe by 4 or more Vehicles in Household
In terms of 4 or more vehicles in household, the demographic groups most similar to Immigrants from Eastern Europe are Immigrants from Uruguay (5.4%, a difference of 0.46%), Alsatian (5.4%, a difference of 0.47%), Immigrants from Western Africa (5.4%, a difference of 0.54%), Immigrants from Spain (5.4%, a difference of 0.71%), and Immigrants from Ireland (5.4%, a difference of 0.79%).
| Demographics | Rating | Rank | 4 or more Vehicles in Household |
| Immigrants | Sudan | 0.6 /100 | #271 | Tragic 5.5% |
| Immigrants | Kazakhstan | 0.6 /100 | #272 | Tragic 5.5% |
| Macedonians | 0.6 /100 | #273 | Tragic 5.5% |
| Blacks/African Americans | 0.6 /100 | #274 | Tragic 5.5% |
| Cambodians | 0.5 /100 | #275 | Tragic 5.5% |
| Immigrants | Latvia | 0.5 /100 | #276 | Tragic 5.5% |
| Immigrants | Bulgaria | 0.5 /100 | #277 | Tragic 5.5% |
| Immigrants | Eastern Europe | 0.4 /100 | #278 | Tragic 5.4% |
| Immigrants | Uruguay | 0.3 /100 | #279 | Tragic 5.4% |
| Alsatians | 0.3 /100 | #280 | Tragic 5.4% |
| Immigrants | Western Africa | 0.3 /100 | #281 | Tragic 5.4% |
| Immigrants | Spain | 0.3 /100 | #282 | Tragic 5.4% |
| Immigrants | Ireland | 0.3 /100 | #283 | Tragic 5.4% |
| Brazilians | 0.3 /100 | #284 | Tragic 5.4% |
| Immigrants | Liberia | 0.2 /100 | #285 | Tragic 5.4% |