Scottish 3 or more Vehicles in Household
COMPARE
Scottish
Select to Compare
3 or more Vehicles in Household
Scottish 3 or more Vehicles in Household
22.6%
3+ VEHICLES AVAILABLE
100.0/ 100
METRIC RATING
48th/ 347
METRIC RANK
Scottish 3 or more Vehicles in Household Correlation Chart
The statistical analysis conducted on geographies consisting of 566,280,219 people shows a substantial positive correlation between the proportion of Scottish and percentage of households with 3 or more vehicles available in the United States with a correlation coefficient (R) of 0.564 and weighted average of 22.6%. On average, for every 1% (one percent) increase in Scottish within a typical geography, there is an increase of 0.76% in percentage of households with 3 or more vehicles available.
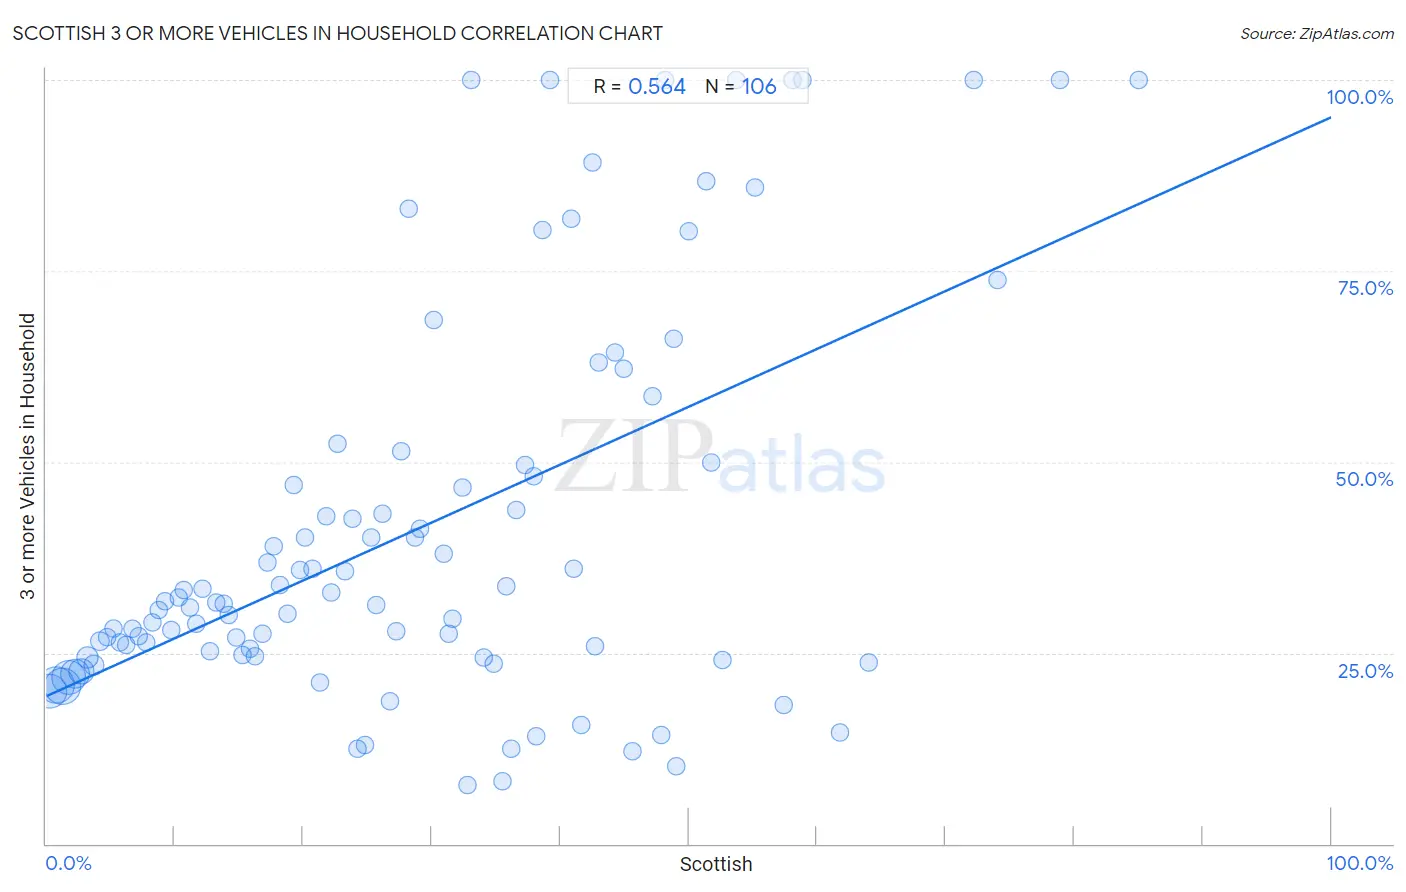
It is essential to understand that the correlation between the percentage of Scottish and percentage of households with 3 or more vehicles available does not imply a direct cause-and-effect relationship. It remains uncertain whether the presence of Scottish influences an upward or downward trend in the level of percentage of households with 3 or more vehicles available within an area, or if Scottish simply ended up residing in those areas with higher or lower levels of percentage of households with 3 or more vehicles available due to other factors.
Demographics Similar to Scottish by 3 or more Vehicles in Household
In terms of 3 or more vehicles in household, the demographic groups most similar to Scottish are Malaysian (22.6%, a difference of 0.010%), American (22.6%, a difference of 0.020%), Scotch-Irish (22.6%, a difference of 0.10%), Sioux (22.6%, a difference of 0.16%), and White/Caucasian (22.6%, a difference of 0.17%).
| Demographics | Rating | Rank | 3 or more Vehicles in Household |
| Germans | 100.0 /100 | #41 | Exceptional 22.7% |
| Natives/Alaskans | 100.0 /100 | #42 | Exceptional 22.7% |
| Osage | 100.0 /100 | #43 | Exceptional 22.7% |
| Cheyenne | 100.0 /100 | #44 | Exceptional 22.7% |
| Ute | 100.0 /100 | #45 | Exceptional 22.7% |
| Americans | 100.0 /100 | #46 | Exceptional 22.6% |
| Malaysians | 100.0 /100 | #47 | Exceptional 22.6% |
| Scottish | 100.0 /100 | #48 | Exceptional 22.6% |
| Scotch-Irish | 100.0 /100 | #49 | Exceptional 22.6% |
| Sioux | 100.0 /100 | #50 | Exceptional 22.6% |
| Whites/Caucasians | 100.0 /100 | #51 | Exceptional 22.6% |
| Welsh | 100.0 /100 | #52 | Exceptional 22.6% |
| Czechs | 100.0 /100 | #53 | Exceptional 22.5% |
| Crow | 100.0 /100 | #54 | Exceptional 22.5% |
| Immigrants from Laos | 100.0 /100 | #55 | Exceptional 22.4% |
Scottish 3 or more Vehicles in Household Correlation Summary
| Measurement | Scottish Data | 3 or more Vehicles in Household Data |
| Minimum | 0.27% | 7.6% |
| Maximum | 85.0% | 100.0% |
| Range | 84.7% | 92.4% |
| Mean | 28.8% | 41.1% |
| Median | 26.4% | 31.5% |
| Interquartile 25% (IQ1) | 13.2% | 24.5% |
| Interquartile 75% (IQ3) | 41.6% | 49.6% |
| Interquartile Range (IQR) | 28.4% | 25.1% |
| Standard Deviation (Sample) | 19.1% | 25.7% |
| Standard Deviation (Population) | 19.0% | 25.6% |
Correlation Details
| Scottish Percentile | Sample Size | 3 or more Vehicles in Household |
[ 0.0% - 0.5% ] 0.27% | 94,826,662 | 19.9% |
[ 0.5% - 1.0% ] 0.76% | 108,118,938 | 20.8% |
[ 1.0% - 1.5% ] 1.26% | 108,047,725 | 20.7% |
[ 1.5% - 2.0% ] 1.73% | 94,442,779 | 21.8% |
[ 2.0% - 2.5% ] 2.23% | 64,685,926 | 22.2% |
[ 2.5% - 3.0% ] 2.74% | 41,652,601 | 22.5% |
[ 3.0% - 3.5% ] 3.23% | 22,085,952 | 24.4% |
[ 3.5% - 4.0% ] 3.72% | 12,942,037 | 23.4% |
[ 4.0% - 4.5% ] 4.21% | 7,748,791 | 26.5% |
[ 4.5% - 5.0% ] 4.72% | 4,079,900 | 27.1% |
[ 5.0% - 5.5% ] 5.22% | 2,499,252 | 28.1% |
[ 5.5% - 6.0% ] 5.71% | 1,514,749 | 26.3% |
[ 6.0% - 6.5% ] 6.22% | 876,559 | 26.1% |
[ 6.5% - 7.0% ] 6.72% | 629,699 | 28.2% |
[ 7.0% - 7.5% ] 7.23% | 468,685 | 27.2% |
[ 7.5% - 8.0% ] 7.74% | 292,459 | 26.4% |
[ 8.0% - 8.5% ] 8.23% | 338,380 | 29.0% |
[ 8.5% - 9.0% ] 8.79% | 181,691 | 30.6% |
[ 9.0% - 9.5% ] 9.22% | 138,042 | 31.7% |
[ 9.5% - 10.0% ] 9.73% | 107,985 | 28.0% |
[ 10.0% - 10.5% ] 10.26% | 75,591 | 32.2% |
[ 10.5% - 11.0% ] 10.73% | 94,187 | 33.2% |
[ 11.0% - 11.5% ] 11.21% | 68,930 | 31.0% |
[ 11.5% - 12.0% ] 11.70% | 43,708 | 28.8% |
[ 12.0% - 12.5% ] 12.20% | 48,122 | 33.4% |
[ 12.5% - 13.0% ] 12.70% | 40,794 | 25.2% |
[ 13.0% - 13.5% ] 13.22% | 22,398 | 31.6% |
[ 13.5% - 14.0% ] 13.79% | 18,330 | 31.4% |
[ 14.0% - 14.5% ] 14.22% | 19,933 | 30.0% |
[ 14.5% - 15.0% ] 14.81% | 29,524 | 27.0% |
[ 15.0% - 15.5% ] 15.25% | 11,965 | 24.8% |
[ 15.5% - 16.0% ] 15.82% | 18,327 | 25.6% |
[ 16.0% - 16.5% ] 16.24% | 4,064 | 24.5% |
[ 16.5% - 17.0% ] 16.81% | 4,796 | 27.6% |
[ 17.0% - 17.5% ] 17.21% | 5,677 | 36.9% |
[ 17.5% - 18.0% ] 17.70% | 12,497 | 39.0% |
[ 18.0% - 18.5% ] 18.20% | 7,439 | 33.9% |
[ 18.5% - 19.0% ] 18.74% | 8,281 | 30.1% |
[ 19.0% - 19.5% ] 19.28% | 3,672 | 46.9% |
[ 19.5% - 20.0% ] 19.75% | 9,764 | 35.8% |
[ 20.0% - 20.5% ] 20.17% | 2,786 | 40.2% |
[ 20.5% - 21.0% ] 20.74% | 6,664 | 36.0% |
[ 21.0% - 21.5% ] 21.30% | 1,648 | 21.2% |
[ 21.5% - 22.0% ] 21.82% | 4,528 | 42.8% |
[ 22.0% - 22.5% ] 22.22% | 999 | 32.8% |
[ 22.5% - 23.0% ] 22.70% | 2,837 | 52.3% |
[ 23.0% - 23.5% ] 23.24% | 1,803 | 35.7% |
[ 23.5% - 24.0% ] 23.82% | 2,594 | 42.5% |
[ 24.0% - 24.5% ] 24.26% | 305 | 12.4% |
[ 24.5% - 25.0% ] 24.83% | 604 | 12.9% |
[ 25.0% - 25.5% ] 25.31% | 2,276 | 40.0% |
[ 25.5% - 26.0% ] 25.71% | 2,159 | 31.3% |
[ 26.0% - 26.5% ] 26.15% | 845 | 43.2% |
[ 26.5% - 27.0% ] 26.71% | 2,325 | 18.7% |
[ 27.0% - 27.5% ] 27.21% | 577 | 27.9% |
[ 27.5% - 28.0% ] 27.65% | 698 | 51.5% |
[ 28.0% - 28.5% ] 28.22% | 1,049 | 83.2% |
[ 28.5% - 29.0% ] 28.66% | 1,120 | 40.1% |
[ 29.0% - 29.5% ] 29.07% | 853 | 41.2% |
[ 30.0% - 30.5% ] 30.17% | 484 | 68.6% |
[ 30.5% - 31.0% ] 30.89% | 123 | 37.9% |
[ 31.0% - 31.5% ] 31.30% | 1,987 | 27.4% |
[ 31.5% - 32.0% ] 31.64% | 1,653 | 29.5% |
[ 32.0% - 32.5% ] 32.36% | 411 | 46.6% |
[ 32.5% - 33.0% ] 32.79% | 305 | 7.6% |
[ 33.0% - 33.5% ] 33.09% | 278 | 100.0% |
[ 34.0% - 34.5% ] 34.03% | 814 | 24.4% |
[ 34.5% - 35.0% ] 34.84% | 1,438 | 23.6% |
[ 35.0% - 35.5% ] 35.50% | 231 | 8.2% |
[ 35.5% - 36.0% ] 35.80% | 176 | 33.7% |
[ 36.0% - 36.5% ] 36.15% | 130 | 12.4% |
[ 36.5% - 37.0% ] 36.56% | 279 | 43.7% |
[ 37.0% - 37.5% ] 37.27% | 322 | 49.6% |
[ 37.5% - 38.0% ] 37.93% | 406 | 48.2% |
[ 38.0% - 38.5% ] 38.17% | 241 | 14.1% |
[ 38.5% - 39.0% ] 38.61% | 101 | 80.3% |
[ 39.0% - 39.5% ] 39.16% | 143 | 100.0% |
[ 40.5% - 41.0% ] 40.81% | 370 | 81.9% |
[ 41.0% - 41.5% ] 41.06% | 492 | 36.0% |
[ 41.5% - 42.0% ] 41.59% | 226 | 15.6% |
[ 42.0% - 42.5% ] 42.50% | 80 | 89.1% |
[ 42.5% - 43.0% ] 42.69% | 834 | 25.8% |
[ 43.0% - 43.5% ] 43.02% | 172 | 63.0% |
[ 44.0% - 44.5% ] 44.24% | 321 | 64.4% |
[ 44.5% - 45.0% ] 44.92% | 492 | 62.2% |
[ 45.5% - 46.0% ] 45.59% | 465 | 12.1% |
[ 47.0% - 47.5% ] 47.17% | 106 | 58.5% |
[ 47.5% - 48.0% ] 47.83% | 46 | 14.3% |
[ 48.0% - 48.5% ] 48.15% | 27 | 100.0% |
[ 48.5% - 49.0% ] 48.87% | 354 | 66.1% |
[ 49.0% - 49.5% ] 49.00% | 451 | 10.2% |
[ 50.0% - 50.5% ] 50.00% | 226 | 80.2% |
[ 51.0% - 51.5% ] 51.38% | 654 | 86.7% |
[ 51.5% - 52.0% ] 51.79% | 112 | 50.0% |
[ 52.5% - 53.0% ] 52.59% | 251 | 24.1% |
[ 53.5% - 54.0% ] 53.66% | 41 | 100.0% |
[ 55.0% - 55.5% ] 55.15% | 136 | 85.9% |
[ 57.0% - 57.5% ] 57.42% | 472 | 18.2% |
[ 58.0% - 58.5% ] 58.05% | 174 | 100.0% |
[ 58.5% - 59.0% ] 58.89% | 90 | 100.0% |
[ 61.5% - 62.0% ] 61.76% | 68 | 14.5% |
[ 64.0% - 64.5% ] 64.00% | 75 | 23.8% |
[ 72.0% - 72.5% ] 72.22% | 90 | 100.0% |
[ 74.0% - 74.5% ] 74.02% | 204 | 73.8% |
[ 78.5% - 79.0% ] 78.91% | 147 | 100.0% |
[ 85.0% - 85.5% ] 85.00% | 40 | 100.0% |