Scottish Married-Couple Family Poverty
COMPARE
Scottish
Select to Compare
Married-Couple Family Poverty
Scottish Married-Couple Family Poverty
4.3%
POVERTY | MARRIED-COUPLE FAMILIES
99.8/ 100
METRIC RATING
42nd/ 347
METRIC RANK
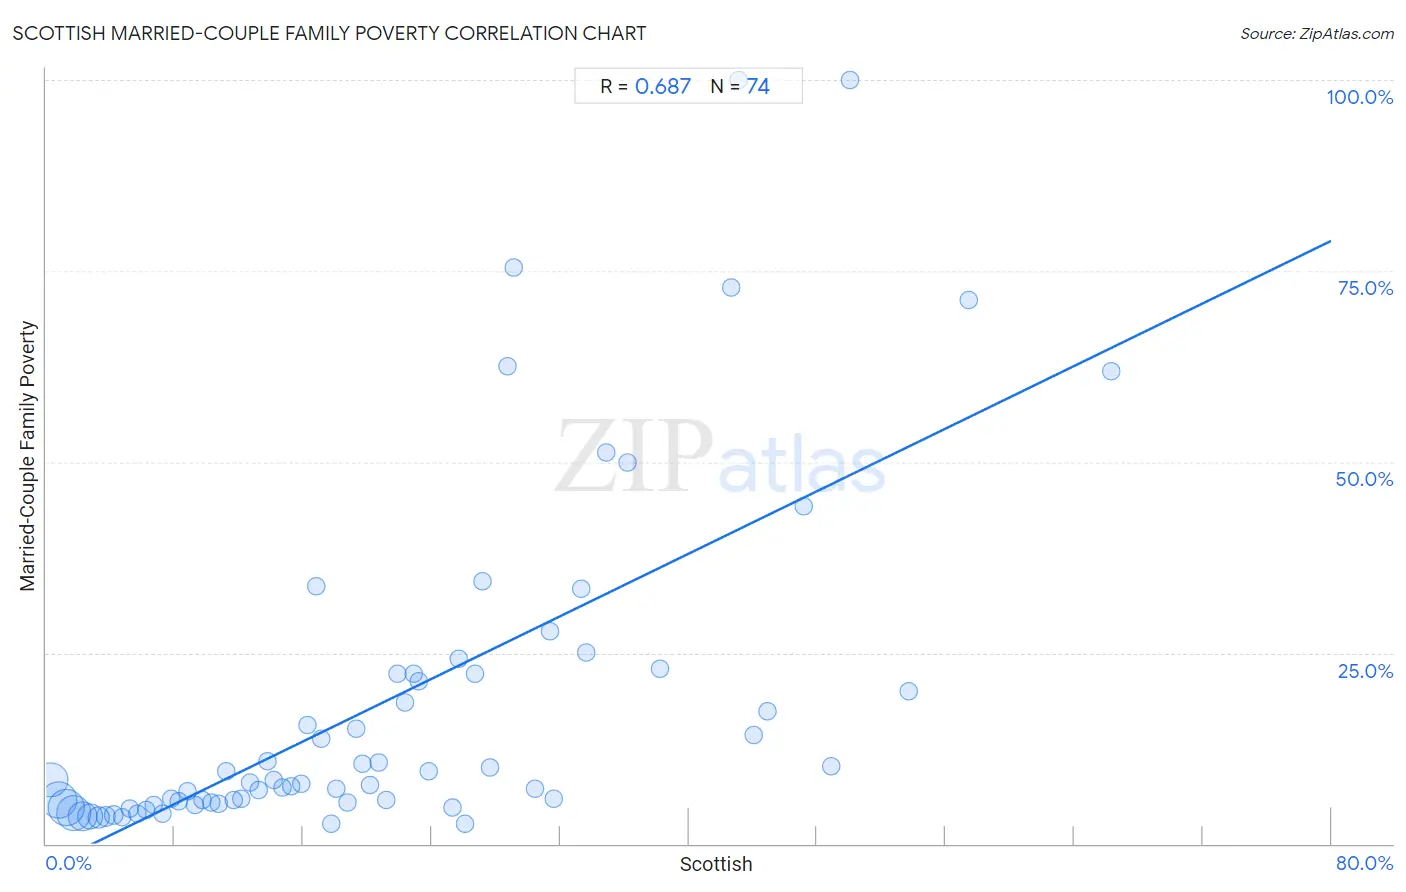
Scottish Married-Couple Family Poverty Correlation Chart
The statistical analysis conducted on geographies consisting of 552,662,179 people shows a significant positive correlation between the proportion of Scottish and poverty level among married-couple families in the United States with a correlation coefficient (R) of 0.687 and weighted average of 4.3%. On average, for every 1% (one percent) increase in Scottish within a typical geography, there is an increase of 1.0% in poverty level among married-couple families.
It is essential to understand that the correlation between the percentage of Scottish and poverty level among married-couple families does not imply a direct cause-and-effect relationship. It remains uncertain whether the presence of Scottish influences an upward or downward trend in the level of poverty level among married-couple families within an area, or if Scottish simply ended up residing in those areas with higher or lower levels of poverty level among married-couple families due to other factors.
Demographics Similar to Scottish by Married-Couple Family Poverty
In terms of married-couple family poverty, the demographic groups most similar to Scottish are Northern European (4.3%, a difference of 0.16%), French Canadian (4.2%, a difference of 0.41%), Swiss (4.3%, a difference of 0.44%), Immigrants from Northern Europe (4.2%, a difference of 0.70%), and Immigrants from Japan (4.3%, a difference of 0.81%).
| Demographics | Rating | Rank | Married-Couple Family Poverty |
| Europeans | 99.9 /100 | #35 | Exceptional 4.2% |
| English | 99.9 /100 | #36 | Exceptional 4.2% |
| Iranians | 99.9 /100 | #37 | Exceptional 4.2% |
| Belgians | 99.9 /100 | #38 | Exceptional 4.2% |
| Immigrants from Northern Europe | 99.8 /100 | #39 | Exceptional 4.2% |
| French Canadians | 99.8 /100 | #40 | Exceptional 4.2% |
| Northern Europeans | 99.8 /100 | #41 | Exceptional 4.3% |
| Scottish | 99.8 /100 | #42 | Exceptional 4.3% |
| Swiss | 99.8 /100 | #43 | Exceptional 4.3% |
| Immigrants from Japan | 99.8 /100 | #44 | Exceptional 4.3% |
| Serbians | 99.8 /100 | #45 | Exceptional 4.3% |
| British | 99.8 /100 | #46 | Exceptional 4.3% |
| Immigrants from South Central Asia | 99.8 /100 | #47 | Exceptional 4.3% |
| Australians | 99.7 /100 | #48 | Exceptional 4.3% |
| Turks | 99.7 /100 | #49 | Exceptional 4.3% |
Scottish Married-Couple Family Poverty Correlation Summary
| Measurement | Scottish Data | Married-Couple Family Poverty Data |
| Minimum | 0.27% | 2.6% |
| Maximum | 66.3% | 100.0% |
| Range | 66.1% | 97.4% |
| Mean | 21.1% | 18.6% |
| Median | 18.4% | 8.2% |
| Interquartile 25% (IQ1) | 9.2% | 5.4% |
| Interquartile 75% (IQ3) | 29.1% | 22.2% |
| Interquartile Range (IQR) | 19.9% | 16.8% |
| Standard Deviation (Sample) | 15.1% | 22.5% |
| Standard Deviation (Population) | 15.0% | 22.4% |
Correlation Details
| Scottish Percentile | Sample Size | Married-Couple Family Poverty |
[ 0.0% - 0.5% ] 0.27% | 93,393,727 | 8.4% |
[ 0.5% - 1.0% ] 0.76% | 106,060,696 | 5.7% |
[ 1.0% - 1.5% ] 1.26% | 106,041,437 | 4.8% |
[ 1.5% - 2.0% ] 1.73% | 92,564,528 | 4.0% |
[ 2.0% - 2.5% ] 2.23% | 63,213,410 | 3.7% |
[ 2.5% - 3.0% ] 2.74% | 40,625,664 | 3.5% |
[ 3.0% - 3.5% ] 3.23% | 21,258,238 | 3.4% |
[ 3.5% - 4.0% ] 3.71% | 12,319,919 | 3.5% |
[ 4.0% - 4.5% ] 4.21% | 7,279,630 | 3.7% |
[ 4.5% - 5.0% ] 4.72% | 3,697,117 | 3.5% |
[ 5.0% - 5.5% ] 5.21% | 2,229,673 | 4.6% |
[ 5.5% - 6.0% ] 5.70% | 1,289,799 | 4.0% |
[ 6.0% - 6.5% ] 6.22% | 751,521 | 4.5% |
[ 6.5% - 7.0% ] 6.71% | 520,716 | 5.1% |
[ 7.0% - 7.5% ] 7.21% | 321,226 | 4.0% |
[ 7.5% - 8.0% ] 7.75% | 196,077 | 5.8% |
[ 8.0% - 8.5% ] 8.24% | 234,441 | 5.6% |
[ 8.5% - 9.0% ] 8.79% | 142,770 | 6.9% |
[ 9.0% - 9.5% ] 9.24% | 89,563 | 5.0% |
[ 9.5% - 10.0% ] 9.71% | 69,152 | 5.7% |
[ 10.0% - 10.5% ] 10.27% | 55,444 | 5.5% |
[ 10.5% - 11.0% ] 10.72% | 68,640 | 5.2% |
[ 11.0% - 11.5% ] 11.19% | 47,451 | 9.5% |
[ 11.5% - 12.0% ] 11.66% | 23,103 | 5.7% |
[ 12.0% - 12.5% ] 12.17% | 35,566 | 5.9% |
[ 12.5% - 13.0% ] 12.69% | 27,164 | 8.1% |
[ 13.0% - 13.5% ] 13.22% | 15,648 | 7.0% |
[ 13.5% - 14.0% ] 13.78% | 11,008 | 10.8% |
[ 14.0% - 14.5% ] 14.17% | 8,623 | 8.3% |
[ 14.5% - 15.0% ] 14.74% | 13,187 | 7.3% |
[ 15.0% - 15.5% ] 15.25% | 5,074 | 7.5% |
[ 15.5% - 16.0% ] 15.87% | 10,753 | 7.9% |
[ 16.0% - 16.5% ] 16.27% | 1,371 | 15.5% |
[ 16.5% - 17.0% ] 16.84% | 861 | 33.8% |
[ 17.0% - 17.5% ] 17.13% | 1,255 | 13.8% |
[ 17.5% - 18.0% ] 17.74% | 5,210 | 2.6% |
[ 18.0% - 18.5% ] 18.09% | 2,692 | 7.3% |
[ 18.5% - 19.0% ] 18.75% | 5,441 | 5.4% |
[ 19.0% - 19.5% ] 19.28% | 804 | 15.1% |
[ 19.5% - 20.0% ] 19.67% | 5,286 | 10.5% |
[ 20.0% - 20.5% ] 20.12% | 1,327 | 7.7% |
[ 20.5% - 21.0% ] 20.73% | 2,866 | 10.6% |
[ 21.0% - 21.5% ] 21.18% | 373 | 5.8% |
[ 21.5% - 22.0% ] 21.83% | 284 | 22.2% |
[ 22.0% - 22.5% ] 22.36% | 313 | 18.4% |
[ 22.5% - 23.0% ] 22.92% | 48 | 22.2% |
[ 23.0% - 23.5% ] 23.16% | 1,114 | 21.3% |
[ 23.5% - 24.0% ] 23.79% | 1,425 | 9.5% |
[ 25.0% - 25.5% ] 25.33% | 533 | 4.8% |
[ 25.5% - 26.0% ] 25.70% | 1,070 | 24.3% |
[ 26.0% - 26.5% ] 26.04% | 192 | 2.7% |
[ 26.5% - 27.0% ] 26.69% | 2,008 | 22.3% |
[ 27.0% - 27.5% ] 27.13% | 258 | 34.4% |
[ 27.5% - 28.0% ] 27.63% | 514 | 10.0% |
[ 28.5% - 29.0% ] 28.70% | 223 | 62.6% |
[ 29.0% - 29.5% ] 29.14% | 151 | 75.4% |
[ 30.0% - 30.5% ] 30.43% | 115 | 7.1% |
[ 31.0% - 31.5% ] 31.34% | 1,101 | 27.9% |
[ 31.5% - 32.0% ] 31.63% | 996 | 5.9% |
[ 33.0% - 33.5% ] 33.33% | 27 | 33.3% |
[ 33.5% - 34.0% ] 33.64% | 217 | 25.0% |
[ 34.5% - 35.0% ] 34.89% | 427 | 51.2% |
[ 36.0% - 36.5% ] 36.21% | 116 | 50.0% |
[ 38.0% - 38.5% ] 38.17% | 241 | 23.0% |
[ 42.5% - 43.0% ] 42.67% | 675 | 72.9% |
[ 43.0% - 43.5% ] 43.10% | 174 | 100.0% |
[ 44.0% - 44.5% ] 44.07% | 59 | 14.3% |
[ 44.5% - 45.0% ] 44.92% | 512 | 17.3% |
[ 47.0% - 47.5% ] 47.19% | 89 | 44.2% |
[ 48.5% - 49.0% ] 48.84% | 258 | 10.1% |
[ 50.0% - 50.5% ] 50.00% | 20 | 100.0% |
[ 53.5% - 54.0% ] 53.66% | 41 | 20.0% |
[ 57.0% - 57.5% ] 57.40% | 331 | 71.2% |
[ 66.0% - 66.5% ] 66.33% | 196 | 61.8% |