Scottish College, Under 1 year
COMPARE
Scottish
Select to Compare
College, Under 1 year
Scottish College, Under 1 year
67.0%
COLLEGE, UNDER 1 YEAR
90.2/ 100
METRIC RATING
128th/ 347
METRIC RANK
Scottish College, Under 1 year Correlation Chart
The statistical analysis conducted on geographies consisting of 567,137,181 people shows a weak positive correlation between the proportion of Scottish and percentage of population with at least college, under 1 year education in the United States with a correlation coefficient (R) of 0.217 and weighted average of 67.0%. On average, for every 1% (one percent) increase in Scottish within a typical geography, there is an increase of 0.17% in percentage of population with at least college, under 1 year education.
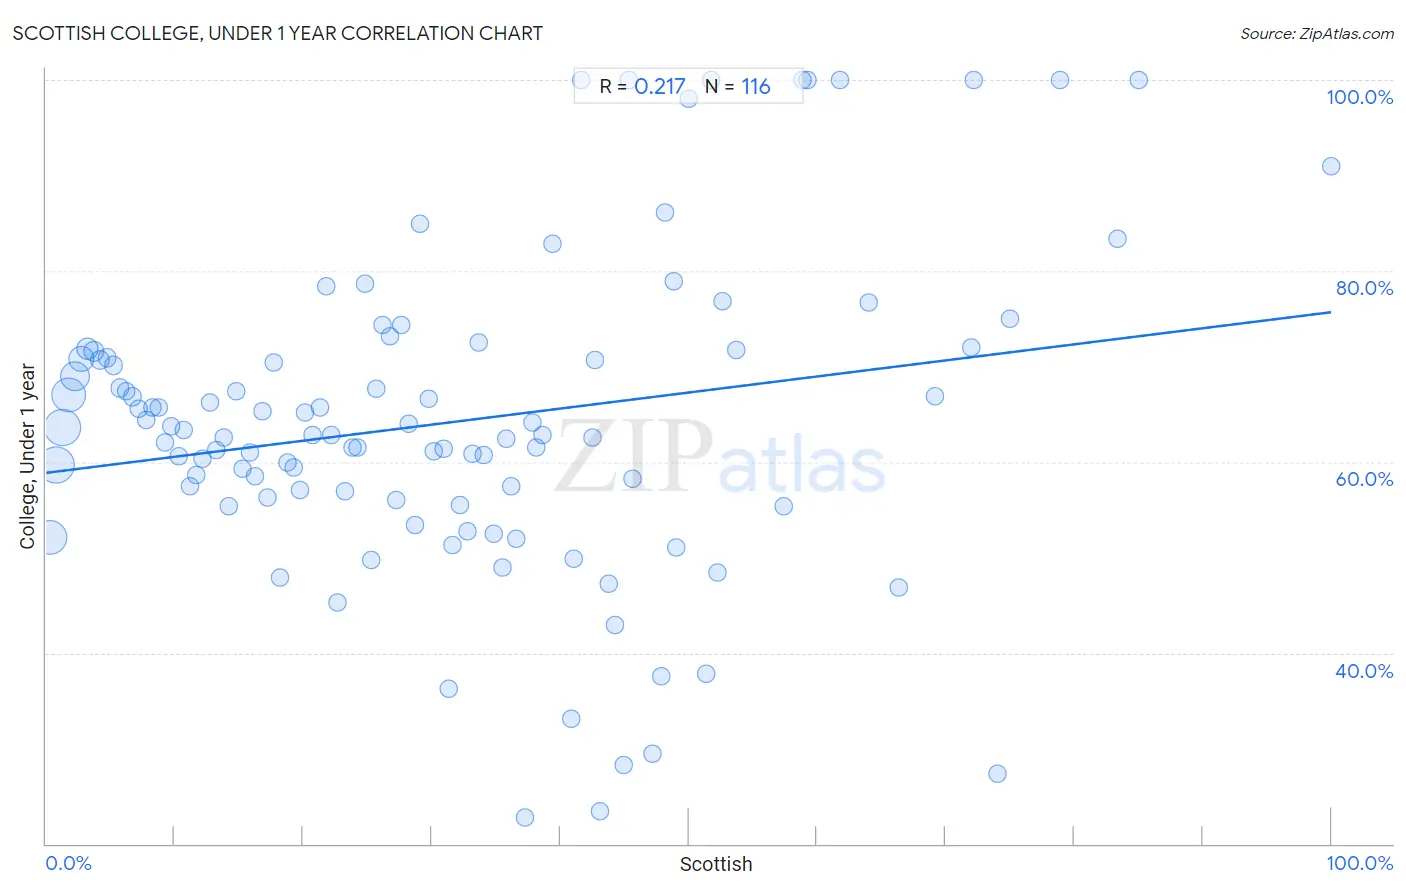
It is essential to understand that the correlation between the percentage of Scottish and percentage of population with at least college, under 1 year education does not imply a direct cause-and-effect relationship. It remains uncertain whether the presence of Scottish influences an upward or downward trend in the level of percentage of population with at least college, under 1 year education within an area, or if Scottish simply ended up residing in those areas with higher or lower levels of percentage of population with at least college, under 1 year education due to other factors.
Demographics Similar to Scottish by College, Under 1 year
In terms of college, under 1 year, the demographic groups most similar to Scottish are Czech (67.1%, a difference of 0.070%), Immigrants from Eastern Africa (67.0%, a difference of 0.080%), Alsatian (67.1%, a difference of 0.14%), Immigrants from Syria (66.9%, a difference of 0.14%), and Finnish (66.9%, a difference of 0.19%).
| Demographics | Rating | Rank | College, Under 1 year |
| Slovenes | 93.3 /100 | #121 | Exceptional 67.3% |
| Immigrants from Jordan | 92.8 /100 | #122 | Exceptional 67.3% |
| Immigrants from Northern Africa | 92.7 /100 | #123 | Exceptional 67.2% |
| Arabs | 92.6 /100 | #124 | Exceptional 67.2% |
| Italians | 91.8 /100 | #125 | Exceptional 67.2% |
| Alsatians | 91.3 /100 | #126 | Exceptional 67.1% |
| Czechs | 90.8 /100 | #127 | Exceptional 67.1% |
| Scottish | 90.2 /100 | #128 | Exceptional 67.0% |
| Immigrants from Eastern Africa | 89.5 /100 | #129 | Excellent 67.0% |
| Immigrants from Syria | 89.0 /100 | #130 | Excellent 66.9% |
| Finns | 88.6 /100 | #131 | Excellent 66.9% |
| Poles | 88.4 /100 | #132 | Excellent 66.9% |
| Immigrants from Brazil | 88.3 /100 | #133 | Excellent 66.9% |
| Iraqis | 88.0 /100 | #134 | Excellent 66.8% |
| Canadians | 87.9 /100 | #135 | Excellent 66.8% |
Scottish College, Under 1 year Correlation Summary
| Measurement | Scottish Data | College, Under 1 year Data |
| Minimum | 0.27% | 22.8% |
| Maximum | 100.0% | 100.0% |
| Range | 99.7% | 77.2% |
| Mean | 31.6% | 64.2% |
| Median | 28.9% | 62.8% |
| Interquartile 25% (IQ1) | 14.5% | 56.1% |
| Interquartile 75% (IQ3) | 44.6% | 71.2% |
| Interquartile Range (IQR) | 30.1% | 15.1% |
| Standard Deviation (Sample) | 21.5% | 16.6% |
| Standard Deviation (Population) | 21.4% | 16.6% |
Correlation Details
| Scottish Percentile | Sample Size | College, Under 1 year |
[ 0.0% - 0.5% ] 0.27% | 95,042,563 | 52.1% |
[ 0.5% - 1.0% ] 0.76% | 108,319,850 | 59.7% |
[ 1.0% - 1.5% ] 1.26% | 108,184,258 | 63.5% |
[ 1.5% - 2.0% ] 1.73% | 94,535,133 | 67.1% |
[ 2.0% - 2.5% ] 2.23% | 64,752,322 | 69.0% |
[ 2.5% - 3.0% ] 2.74% | 41,689,352 | 70.8% |
[ 3.0% - 3.5% ] 3.23% | 22,111,801 | 71.9% |
[ 3.5% - 4.0% ] 3.72% | 12,961,489 | 71.5% |
[ 4.0% - 4.5% ] 4.21% | 7,757,663 | 70.7% |
[ 4.5% - 5.0% ] 4.72% | 4,090,299 | 70.9% |
[ 5.0% - 5.5% ] 5.22% | 2,504,834 | 70.1% |
[ 5.5% - 6.0% ] 5.71% | 1,517,604 | 67.7% |
[ 6.0% - 6.5% ] 6.22% | 878,828 | 67.4% |
[ 6.5% - 7.0% ] 6.72% | 631,320 | 66.8% |
[ 7.0% - 7.5% ] 7.23% | 470,486 | 65.5% |
[ 7.5% - 8.0% ] 7.74% | 294,681 | 64.4% |
[ 8.0% - 8.5% ] 8.23% | 343,023 | 65.7% |
[ 8.5% - 9.0% ] 8.78% | 183,514 | 65.7% |
[ 9.0% - 9.5% ] 9.22% | 140,204 | 62.0% |
[ 9.5% - 10.0% ] 9.73% | 108,449 | 63.7% |
[ 10.0% - 10.5% ] 10.26% | 77,291 | 60.5% |
[ 10.5% - 11.0% ] 10.73% | 95,820 | 63.4% |
[ 11.0% - 11.5% ] 11.21% | 69,771 | 57.5% |
[ 11.5% - 12.0% ] 11.70% | 44,393 | 58.6% |
[ 12.0% - 12.5% ] 12.20% | 48,883 | 60.4% |
[ 12.5% - 13.0% ] 12.71% | 42,418 | 66.2% |
[ 13.0% - 13.5% ] 13.22% | 22,927 | 61.2% |
[ 13.5% - 14.0% ] 13.79% | 20,967 | 62.6% |
[ 14.0% - 14.5% ] 14.22% | 20,297 | 55.3% |
[ 14.5% - 15.0% ] 14.81% | 29,634 | 67.4% |
[ 15.0% - 15.5% ] 15.25% | 11,965 | 59.3% |
[ 15.5% - 16.0% ] 15.82% | 18,365 | 61.0% |
[ 16.0% - 16.5% ] 16.23% | 4,886 | 58.5% |
[ 16.5% - 17.0% ] 16.79% | 5,228 | 65.3% |
[ 17.0% - 17.5% ] 17.22% | 6,270 | 56.3% |
[ 17.5% - 18.0% ] 17.70% | 12,662 | 70.5% |
[ 18.0% - 18.5% ] 18.21% | 7,623 | 47.9% |
[ 18.5% - 19.0% ] 18.74% | 8,389 | 59.9% |
[ 19.0% - 19.5% ] 19.28% | 4,269 | 59.5% |
[ 19.5% - 20.0% ] 19.75% | 9,764 | 57.1% |
[ 20.0% - 20.5% ] 20.17% | 2,786 | 65.2% |
[ 20.5% - 21.0% ] 20.74% | 6,693 | 62.8% |
[ 21.0% - 21.5% ] 21.30% | 1,695 | 65.7% |
[ 21.5% - 22.0% ] 21.82% | 4,528 | 78.4% |
[ 22.0% - 22.5% ] 22.21% | 1,148 | 62.8% |
[ 22.5% - 23.0% ] 22.69% | 3,059 | 45.3% |
[ 23.0% - 23.5% ] 23.24% | 1,850 | 56.9% |
[ 23.5% - 24.0% ] 23.82% | 2,594 | 61.5% |
[ 24.0% - 24.5% ] 24.25% | 367 | 61.5% |
[ 24.5% - 25.0% ] 24.82% | 705 | 78.7% |
[ 25.0% - 25.5% ] 25.31% | 2,276 | 49.7% |
[ 25.5% - 26.0% ] 25.73% | 1,753 | 67.7% |
[ 26.0% - 26.5% ] 26.16% | 994 | 74.4% |
[ 26.5% - 27.0% ] 26.71% | 2,325 | 73.2% |
[ 27.0% - 27.5% ] 27.22% | 753 | 56.0% |
[ 27.5% - 28.0% ] 27.66% | 734 | 74.3% |
[ 28.0% - 28.5% ] 28.22% | 1,049 | 64.0% |
[ 28.5% - 29.0% ] 28.68% | 1,384 | 53.4% |
[ 29.0% - 29.5% ] 29.11% | 979 | 84.9% |
[ 29.5% - 30.0% ] 29.73% | 111 | 66.7% |
[ 30.0% - 30.5% ] 30.17% | 484 | 61.1% |
[ 30.5% - 31.0% ] 30.93% | 236 | 61.4% |
[ 31.0% - 31.5% ] 31.30% | 1,987 | 36.3% |
[ 31.5% - 32.0% ] 31.64% | 1,653 | 51.3% |
[ 32.0% - 32.5% ] 32.16% | 967 | 55.4% |
[ 32.5% - 33.0% ] 32.81% | 442 | 52.7% |
[ 33.0% - 33.5% ] 33.12% | 317 | 60.9% |
[ 33.5% - 34.0% ] 33.64% | 217 | 72.5% |
[ 34.0% - 34.5% ] 34.04% | 1,137 | 60.7% |
[ 34.5% - 35.0% ] 34.84% | 1,438 | 52.5% |
[ 35.0% - 35.5% ] 35.50% | 231 | 48.9% |
[ 35.5% - 36.0% ] 35.80% | 176 | 62.5% |
[ 36.0% - 36.5% ] 36.18% | 246 | 57.5% |
[ 36.5% - 37.0% ] 36.56% | 279 | 52.0% |
[ 37.0% - 37.5% ] 37.28% | 338 | 22.8% |
[ 37.5% - 38.0% ] 37.86% | 560 | 64.1% |
[ 38.0% - 38.5% ] 38.14% | 409 | 61.5% |
[ 38.5% - 39.0% ] 38.61% | 101 | 62.9% |
[ 39.0% - 39.5% ] 39.35% | 371 | 82.8% |
[ 40.5% - 41.0% ] 40.81% | 370 | 33.1% |
[ 41.0% - 41.5% ] 41.06% | 492 | 49.8% |
[ 41.5% - 42.0% ] 41.59% | 226 | 100.0% |
[ 42.0% - 42.5% ] 42.50% | 80 | 62.5% |
[ 42.5% - 43.0% ] 42.69% | 834 | 70.7% |
[ 43.0% - 43.5% ] 43.06% | 346 | 23.3% |
[ 43.5% - 44.0% ] 43.75% | 64 | 47.2% |
[ 44.0% - 44.5% ] 44.24% | 321 | 42.9% |
[ 44.5% - 45.0% ] 44.92% | 512 | 28.2% |
[ 45.0% - 45.5% ] 45.31% | 64 | 100.0% |
[ 45.5% - 46.0% ] 45.59% | 465 | 58.2% |
[ 47.0% - 47.5% ] 47.17% | 106 | 29.5% |
[ 47.5% - 48.0% ] 47.83% | 46 | 37.5% |
[ 48.0% - 48.5% ] 48.15% | 54 | 86.1% |
[ 48.5% - 49.0% ] 48.87% | 354 | 79.0% |
[ 49.0% - 49.5% ] 49.04% | 679 | 51.1% |
[ 50.0% - 50.5% ] 50.00% | 152 | 98.0% |
[ 51.0% - 51.5% ] 51.38% | 654 | 37.8% |
[ 51.5% - 52.0% ] 51.72% | 174 | 100.0% |
[ 52.0% - 52.5% ] 52.22% | 90 | 48.4% |
[ 52.5% - 53.0% ] 52.63% | 304 | 76.8% |
[ 53.5% - 54.0% ] 53.66% | 164 | 71.7% |
[ 57.0% - 57.5% ] 57.42% | 472 | 55.4% |
[ 58.5% - 59.0% ] 58.89% | 90 | 100.0% |
[ 59.0% - 59.5% ] 59.26% | 54 | 100.0% |
[ 61.5% - 62.0% ] 61.76% | 68 | 100.0% |
[ 64.0% - 64.5% ] 64.00% | 75 | 76.7% |
[ 66.0% - 66.5% ] 66.33% | 196 | 46.9% |
[ 69.0% - 69.5% ] 69.16% | 107 | 66.8% |
[ 72.0% - 72.5% ] 72.00% | 50 | 72.0% |
[ 72.0% - 72.5% ] 72.22% | 90 | 100.0% |
[ 74.0% - 74.5% ] 74.02% | 204 | 27.4% |
[ 75.0% - 75.5% ] 75.00% | 32 | 75.0% |
[ 78.5% - 79.0% ] 78.91% | 147 | 100.0% |
[ 83.0% - 83.5% ] 83.33% | 6 | 83.3% |
[ 85.0% - 85.5% ] 85.00% | 40 | 100.0% |
[ 99.5% - 100.0% ] 100.00% | 132 | 90.9% |