Scottish 2 or more Vehicles in Household
COMPARE
Scottish
Select to Compare
2 or more Vehicles in Household
Scottish 2 or more Vehicles in Household
61.2%
2+ VEHICLES AVAILABLE
100.0/ 100
METRIC RATING
19th/ 347
METRIC RANK
Scottish 2 or more Vehicles in Household Correlation Chart
The statistical analysis conducted on geographies consisting of 566,626,490 people shows a moderate positive correlation between the proportion of Scottish and percentage of households with 2 or more vehicles available in the United States with a correlation coefficient (R) of 0.458 and weighted average of 61.2%. On average, for every 1% (one percent) increase in Scottish within a typical geography, there is an increase of 0.37% in percentage of households with 2 or more vehicles available.
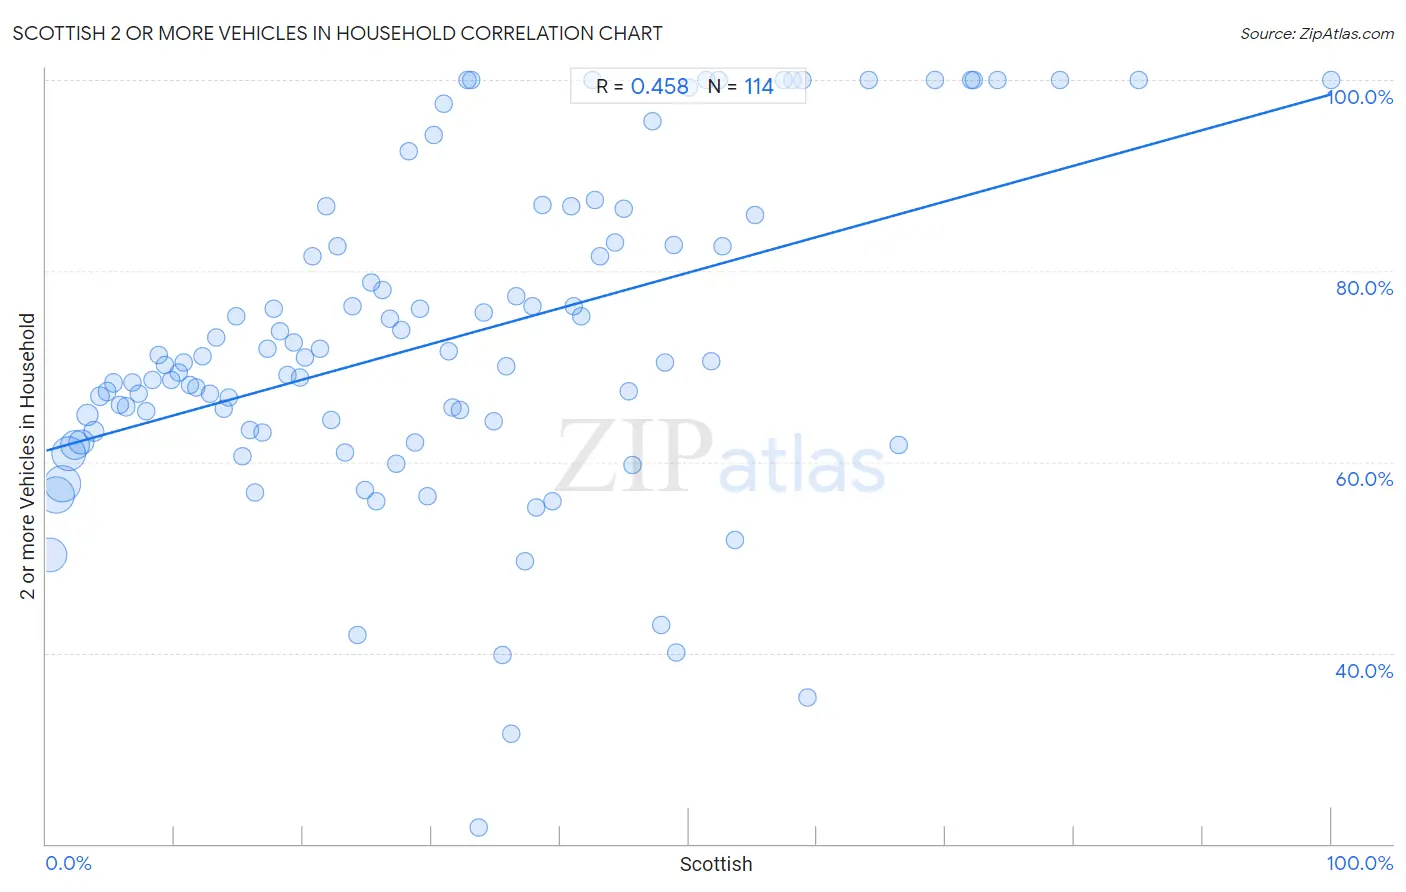
It is essential to understand that the correlation between the percentage of Scottish and percentage of households with 2 or more vehicles available does not imply a direct cause-and-effect relationship. It remains uncertain whether the presence of Scottish influences an upward or downward trend in the level of percentage of households with 2 or more vehicles available within an area, or if Scottish simply ended up residing in those areas with higher or lower levels of percentage of households with 2 or more vehicles available due to other factors.
Demographics Similar to Scottish by 2 or more Vehicles in Household
In terms of 2 or more vehicles in household, the demographic groups most similar to Scottish are European (61.4%, a difference of 0.20%), Basque (61.4%, a difference of 0.22%), Native Hawaiian (61.4%, a difference of 0.28%), Nepalese (61.4%, a difference of 0.31%), and Sri Lankan (61.0%, a difference of 0.35%).
| Demographics | Rating | Rank | 2 or more Vehicles in Household |
| Germans | 100.0 /100 | #12 | Exceptional 61.6% |
| Samoans | 100.0 /100 | #13 | Exceptional 61.5% |
| Czechs | 100.0 /100 | #14 | Exceptional 61.5% |
| Nepalese | 100.0 /100 | #15 | Exceptional 61.4% |
| Native Hawaiians | 100.0 /100 | #16 | Exceptional 61.4% |
| Basques | 100.0 /100 | #17 | Exceptional 61.4% |
| Europeans | 100.0 /100 | #18 | Exceptional 61.4% |
| Scottish | 100.0 /100 | #19 | Exceptional 61.2% |
| Sri Lankans | 100.0 /100 | #20 | Exceptional 61.0% |
| Koreans | 100.0 /100 | #21 | Exceptional 61.0% |
| Swiss | 100.0 /100 | #22 | Exceptional 61.0% |
| Scotch-Irish | 100.0 /100 | #23 | Exceptional 60.9% |
| Immigrants from Vietnam | 100.0 /100 | #24 | Exceptional 60.9% |
| Whites/Caucasians | 100.0 /100 | #25 | Exceptional 60.8% |
| Welsh | 100.0 /100 | #26 | Exceptional 60.8% |
Scottish 2 or more Vehicles in Household Correlation Summary
| Measurement | Scottish Data | 2 or more Vehicles in Household Data |
| Minimum | 0.27% | 21.7% |
| Maximum | 100.0% | 100.0% |
| Range | 99.7% | 78.3% |
| Mean | 30.8% | 72.7% |
| Median | 28.5% | 70.5% |
| Interquartile 25% (IQ1) | 14.2% | 63.2% |
| Interquartile 75% (IQ3) | 44.2% | 82.8% |
| Interquartile Range (IQR) | 30.0% | 19.6% |
| Standard Deviation (Sample) | 20.7% | 16.9% |
| Standard Deviation (Population) | 20.6% | 16.8% |
Correlation Details
| Scottish Percentile | Sample Size | 2 or more Vehicles in Household |
[ 0.0% - 0.5% ] 0.27% | 94,929,682 | 50.3% |
[ 0.5% - 1.0% ] 0.76% | 108,173,209 | 56.6% |
[ 1.0% - 1.5% ] 1.26% | 108,126,026 | 57.8% |
[ 1.5% - 2.0% ] 1.73% | 94,479,100 | 60.9% |
[ 2.0% - 2.5% ] 2.23% | 64,697,137 | 61.8% |
[ 2.5% - 3.0% ] 2.74% | 41,663,936 | 62.1% |
[ 3.0% - 3.5% ] 3.23% | 22,094,975 | 65.0% |
[ 3.5% - 4.0% ] 3.72% | 12,950,106 | 63.2% |
[ 4.0% - 4.5% ] 4.21% | 7,751,117 | 66.9% |
[ 4.5% - 5.0% ] 4.72% | 4,081,028 | 67.3% |
[ 5.0% - 5.5% ] 5.22% | 2,500,947 | 68.3% |
[ 5.5% - 6.0% ] 5.71% | 1,516,690 | 66.0% |
[ 6.0% - 6.5% ] 6.22% | 878,467 | 65.8% |
[ 6.5% - 7.0% ] 6.72% | 631,320 | 68.3% |
[ 7.0% - 7.5% ] 7.23% | 469,220 | 67.1% |
[ 7.5% - 8.0% ] 7.74% | 294,475 | 65.3% |
[ 8.0% - 8.5% ] 8.23% | 341,562 | 68.5% |
[ 8.5% - 9.0% ] 8.78% | 182,942 | 71.2% |
[ 9.0% - 9.5% ] 9.22% | 138,788 | 70.2% |
[ 9.5% - 10.0% ] 9.73% | 108,449 | 68.6% |
[ 10.0% - 10.5% ] 10.26% | 77,291 | 69.3% |
[ 10.5% - 11.0% ] 10.73% | 94,946 | 70.4% |
[ 11.0% - 11.5% ] 11.21% | 69,665 | 68.1% |
[ 11.5% - 12.0% ] 11.70% | 44,393 | 67.8% |
[ 12.0% - 12.5% ] 12.20% | 48,835 | 71.1% |
[ 12.5% - 13.0% ] 12.71% | 41,515 | 67.1% |
[ 13.0% - 13.5% ] 13.22% | 22,927 | 73.0% |
[ 13.5% - 14.0% ] 13.79% | 20,967 | 65.6% |
[ 14.0% - 14.5% ] 14.22% | 20,304 | 66.8% |
[ 14.5% - 15.0% ] 14.81% | 29,634 | 75.2% |
[ 15.0% - 15.5% ] 15.25% | 11,965 | 60.5% |
[ 15.5% - 16.0% ] 15.82% | 18,365 | 63.4% |
[ 16.0% - 16.5% ] 16.23% | 4,886 | 56.8% |
[ 16.5% - 17.0% ] 16.79% | 5,228 | 63.0% |
[ 17.0% - 17.5% ] 17.21% | 5,787 | 71.9% |
[ 17.5% - 18.0% ] 17.70% | 12,662 | 76.0% |
[ 18.0% - 18.5% ] 18.21% | 7,623 | 73.6% |
[ 18.5% - 19.0% ] 18.74% | 8,447 | 69.1% |
[ 19.0% - 19.5% ] 19.28% | 4,197 | 72.4% |
[ 19.5% - 20.0% ] 19.75% | 9,764 | 68.8% |
[ 20.0% - 20.5% ] 20.17% | 2,786 | 71.0% |
[ 20.5% - 21.0% ] 20.74% | 6,693 | 81.6% |
[ 21.0% - 21.5% ] 21.30% | 1,695 | 71.8% |
[ 21.5% - 22.0% ] 21.82% | 4,528 | 86.8% |
[ 22.0% - 22.5% ] 22.21% | 1,148 | 64.4% |
[ 22.5% - 23.0% ] 22.69% | 3,059 | 82.6% |
[ 23.0% - 23.5% ] 23.24% | 1,803 | 61.0% |
[ 23.5% - 24.0% ] 23.82% | 2,594 | 76.3% |
[ 24.0% - 24.5% ] 24.25% | 367 | 41.9% |
[ 24.5% - 25.0% ] 24.82% | 705 | 57.1% |
[ 25.0% - 25.5% ] 25.31% | 2,276 | 78.8% |
[ 25.5% - 26.0% ] 25.71% | 2,198 | 55.9% |
[ 26.0% - 26.5% ] 26.16% | 994 | 78.0% |
[ 26.5% - 27.0% ] 26.71% | 2,325 | 75.0% |
[ 27.0% - 27.5% ] 27.22% | 753 | 59.8% |
[ 27.5% - 28.0% ] 27.66% | 734 | 73.8% |
[ 28.0% - 28.5% ] 28.22% | 1,049 | 92.6% |
[ 28.5% - 29.0% ] 28.68% | 1,384 | 62.1% |
[ 29.0% - 29.5% ] 29.11% | 979 | 76.1% |
[ 29.5% - 30.0% ] 29.70% | 101 | 56.3% |
[ 30.0% - 30.5% ] 30.17% | 484 | 94.2% |
[ 30.5% - 31.0% ] 30.93% | 236 | 97.6% |
[ 31.0% - 31.5% ] 31.30% | 1,987 | 71.6% |
[ 31.5% - 32.0% ] 31.64% | 1,653 | 65.7% |
[ 32.0% - 32.5% ] 32.16% | 967 | 65.4% |
[ 32.5% - 33.0% ] 32.79% | 305 | 100.0% |
[ 33.0% - 33.5% ] 33.10% | 287 | 100.0% |
[ 33.5% - 34.0% ] 33.64% | 217 | 21.7% |
[ 34.0% - 34.5% ] 34.04% | 1,137 | 75.7% |
[ 34.5% - 35.0% ] 34.84% | 1,438 | 64.3% |
[ 35.0% - 35.5% ] 35.50% | 231 | 39.7% |
[ 35.5% - 36.0% ] 35.80% | 176 | 70.0% |
[ 36.0% - 36.5% ] 36.18% | 246 | 31.5% |
[ 36.5% - 37.0% ] 36.56% | 279 | 77.4% |
[ 37.0% - 37.5% ] 37.27% | 322 | 49.6% |
[ 37.5% - 38.0% ] 37.86% | 560 | 76.2% |
[ 38.0% - 38.5% ] 38.14% | 388 | 55.3% |
[ 38.5% - 39.0% ] 38.61% | 101 | 86.9% |
[ 39.0% - 39.5% ] 39.35% | 371 | 55.8% |
[ 40.5% - 41.0% ] 40.81% | 370 | 86.7% |
[ 41.0% - 41.5% ] 41.06% | 492 | 76.3% |
[ 41.5% - 42.0% ] 41.59% | 226 | 75.2% |
[ 42.0% - 42.5% ] 42.50% | 80 | 100.0% |
[ 42.5% - 43.0% ] 42.69% | 834 | 87.4% |
[ 43.0% - 43.5% ] 43.06% | 346 | 81.6% |
[ 44.0% - 44.5% ] 44.24% | 321 | 83.0% |
[ 44.5% - 45.0% ] 44.92% | 512 | 86.6% |
[ 45.0% - 45.5% ] 45.31% | 64 | 67.4% |
[ 45.5% - 46.0% ] 45.59% | 465 | 59.7% |
[ 47.0% - 47.5% ] 47.17% | 106 | 95.6% |
[ 47.5% - 48.0% ] 47.83% | 46 | 42.9% |
[ 48.0% - 48.5% ] 48.15% | 54 | 70.5% |
[ 48.5% - 49.0% ] 48.87% | 354 | 82.8% |
[ 49.0% - 49.5% ] 49.04% | 679 | 40.1% |
[ 50.0% - 50.5% ] 50.00% | 330 | 99.2% |
[ 51.0% - 51.5% ] 51.38% | 654 | 100.0% |
[ 51.5% - 52.0% ] 51.79% | 112 | 70.6% |
[ 52.0% - 52.5% ] 52.38% | 21 | 100.0% |
[ 52.5% - 53.0% ] 52.63% | 285 | 82.6% |
[ 53.5% - 54.0% ] 53.60% | 125 | 51.8% |
[ 55.0% - 55.5% ] 55.15% | 136 | 85.9% |
[ 57.0% - 57.5% ] 57.42% | 472 | 100.0% |
[ 58.0% - 58.5% ] 58.05% | 174 | 100.0% |
[ 58.5% - 59.0% ] 58.89% | 90 | 100.0% |
[ 59.0% - 59.5% ] 59.26% | 54 | 35.3% |
[ 64.0% - 64.5% ] 64.00% | 75 | 100.0% |
[ 66.0% - 66.5% ] 66.33% | 196 | 61.8% |
[ 69.0% - 69.5% ] 69.16% | 107 | 100.0% |
[ 72.0% - 72.5% ] 72.00% | 50 | 100.0% |
[ 72.0% - 72.5% ] 72.22% | 90 | 100.0% |
[ 74.0% - 74.5% ] 74.02% | 204 | 100.0% |
[ 78.5% - 79.0% ] 78.91% | 147 | 100.0% |
[ 85.0% - 85.5% ] 85.00% | 40 | 100.0% |
[ 99.5% - 100.0% ] 100.00% | 46 | 100.0% |