Scottish Unemployment Among Women with Children Ages 6 to 17 years
COMPARE
Scottish
Select to Compare
Unemployment Among Women with Children Ages 6 to 17 years
Scottish Unemployment Among Women with Children Ages 6 to 17 years
9.4%
UNEMPLOYMENT | WOMEN W/ CHILDREN 6 TO 17
2.0/ 100
METRIC RATING
243rd/ 347
METRIC RANK
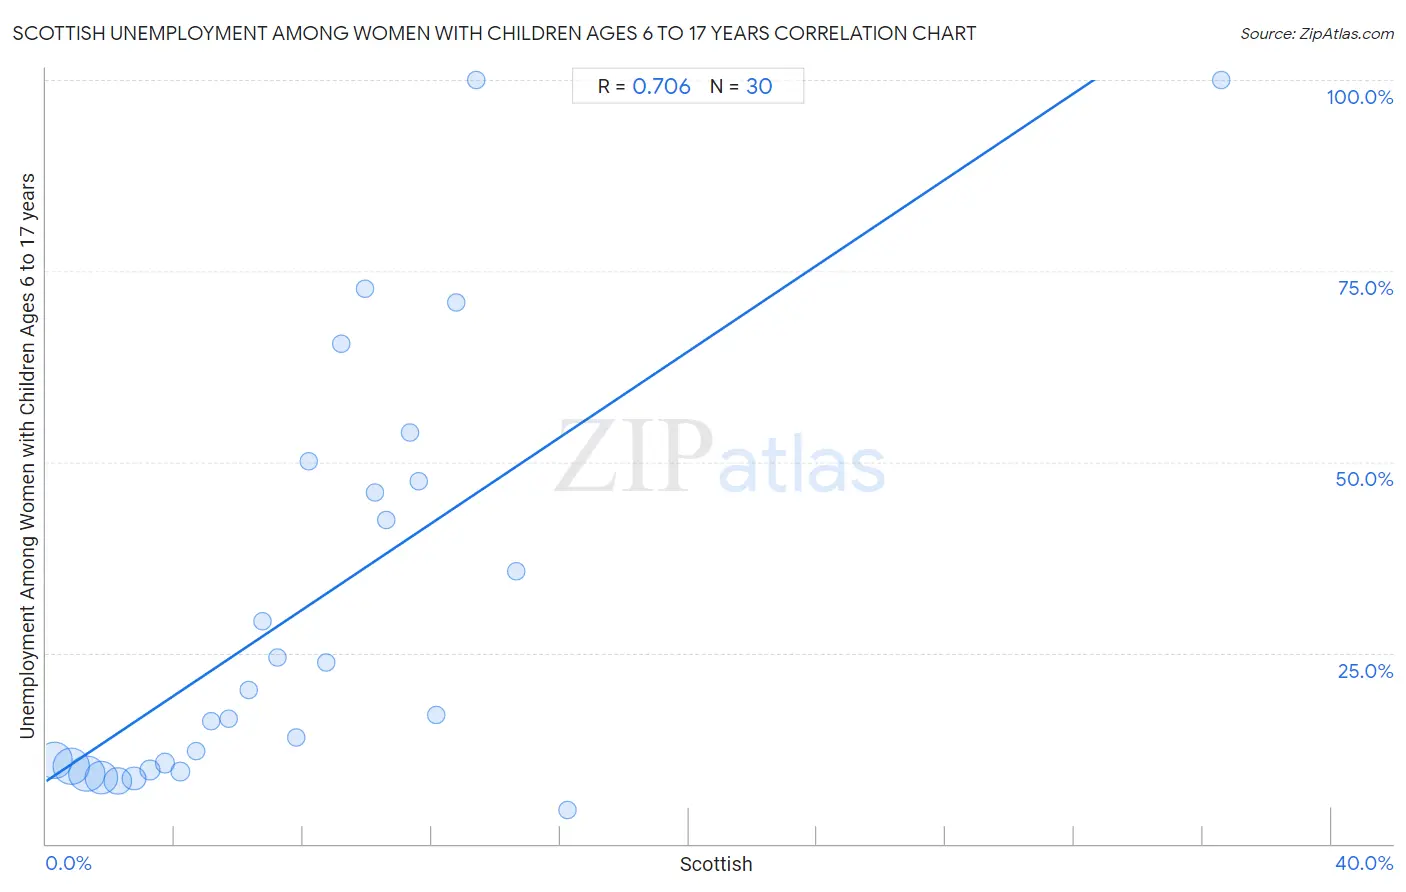
Scottish Unemployment Among Women with Children Ages 6 to 17 years Correlation Chart
The statistical analysis conducted on geographies consisting of 354,178,557 people shows a strong positive correlation between the proportion of Scottish and unemployment rate among women with children between the ages 6 and 17 in the United States with a correlation coefficient (R) of 0.706 and weighted average of 9.4%. On average, for every 1% (one percent) increase in Scottish within a typical geography, there is an increase of 2.8% in unemployment rate among women with children between the ages 6 and 17.
It is essential to understand that the correlation between the percentage of Scottish and unemployment rate among women with children between the ages 6 and 17 does not imply a direct cause-and-effect relationship. It remains uncertain whether the presence of Scottish influences an upward or downward trend in the level of unemployment rate among women with children between the ages 6 and 17 within an area, or if Scottish simply ended up residing in those areas with higher or lower levels of unemployment rate among women with children between the ages 6 and 17 due to other factors.
Demographics Similar to Scottish by Unemployment Among Women with Children Ages 6 to 17 years
In terms of unemployment among women with children ages 6 to 17 years, the demographic groups most similar to Scottish are English (9.4%, a difference of 0.050%), Immigrants from Cameroon (9.4%, a difference of 0.080%), Immigrants from Colombia (9.3%, a difference of 0.090%), Colombian (9.3%, a difference of 0.11%), and Guatemalan (9.3%, a difference of 0.18%).
| Demographics | Rating | Rank | Unemployment Among Women with Children Ages 6 to 17 years |
| Hungarians | 3.0 /100 | #236 | Tragic 9.3% |
| Immigrants from Belize | 2.8 /100 | #237 | Tragic 9.3% |
| Arabs | 2.7 /100 | #238 | Tragic 9.3% |
| Immigrants from Saudi Arabia | 2.7 /100 | #239 | Tragic 9.3% |
| Guatemalans | 2.3 /100 | #240 | Tragic 9.3% |
| Colombians | 2.2 /100 | #241 | Tragic 9.3% |
| Immigrants from Colombia | 2.1 /100 | #242 | Tragic 9.3% |
| Scottish | 2.0 /100 | #243 | Tragic 9.4% |
| English | 1.9 /100 | #244 | Tragic 9.4% |
| Immigrants from Cameroon | 1.8 /100 | #245 | Tragic 9.4% |
| Immigrants from Africa | 1.6 /100 | #246 | Tragic 9.4% |
| Poles | 1.5 /100 | #247 | Tragic 9.4% |
| Dutch | 1.5 /100 | #248 | Tragic 9.4% |
| Immigrants from South America | 1.5 /100 | #249 | Tragic 9.4% |
| Immigrants from Guatemala | 1.3 /100 | #250 | Tragic 9.4% |
Scottish Unemployment Among Women with Children Ages 6 to 17 years Correlation Summary
| Measurement | Scottish Data | Unemployment Among Women with Children Ages 6 to 17 years Data |
| Minimum | 0.27% | 4.5% |
| Maximum | 36.6% | 100.0% |
| Range | 36.3% | 95.5% |
| Mean | 8.3% | 31.6% |
| Median | 7.5% | 18.5% |
| Interquartile 25% (IQ1) | 3.7% | 10.1% |
| Interquartile 75% (IQ3) | 11.3% | 47.4% |
| Interquartile Range (IQR) | 7.6% | 37.3% |
| Standard Deviation (Sample) | 6.9% | 27.5% |
| Standard Deviation (Population) | 6.8% | 27.0% |
Correlation Details
| Scottish Percentile | Sample Size | Unemployment Among Women with Children Ages 6 to 17 years |
[ 0.0% - 0.5% ] 0.27% | 71,867,612 | 10.9% |
[ 0.5% - 1.0% ] 0.76% | 74,227,990 | 10.1% |
[ 1.0% - 1.5% ] 1.26% | 70,153,662 | 9.1% |
[ 1.5% - 2.0% ] 1.73% | 58,716,381 | 8.7% |
[ 2.0% - 2.5% ] 2.22% | 37,077,802 | 8.2% |
[ 2.5% - 3.0% ] 2.74% | 22,153,199 | 8.5% |
[ 3.0% - 3.5% ] 3.22% | 9,855,990 | 9.6% |
[ 3.5% - 4.0% ] 3.70% | 5,164,670 | 10.6% |
[ 4.0% - 4.5% ] 4.18% | 2,596,155 | 9.5% |
[ 4.5% - 5.0% ] 4.66% | 1,053,288 | 12.1% |
[ 5.0% - 5.5% ] 5.12% | 524,950 | 16.1% |
[ 5.5% - 6.0% ] 5.68% | 351,895 | 16.4% |
[ 6.0% - 6.5% ] 6.32% | 81,822 | 20.1% |
[ 6.5% - 7.0% ] 6.72% | 101,800 | 29.2% |
[ 7.0% - 7.5% ] 7.19% | 105,951 | 24.3% |
[ 7.5% - 8.0% ] 7.77% | 28,266 | 13.9% |
[ 8.0% - 8.5% ] 8.16% | 36,215 | 50.1% |
[ 8.5% - 9.0% ] 8.74% | 21,843 | 23.7% |
[ 9.0% - 9.5% ] 9.16% | 6,373 | 65.5% |
[ 9.5% - 10.0% ] 9.94% | 10,433 | 72.7% |
[ 10.0% - 10.5% ] 10.24% | 10,811 | 45.9% |
[ 10.5% - 11.0% ] 10.58% | 4,262 | 42.3% |
[ 11.0% - 11.5% ] 11.32% | 3,764 | 53.9% |
[ 11.5% - 12.0% ] 11.61% | 2,886 | 47.4% |
[ 12.0% - 12.5% ] 12.13% | 12,478 | 16.9% |
[ 12.5% - 13.0% ] 12.74% | 5,767 | 70.9% |
[ 13.0% - 13.5% ] 13.38% | 628 | 100.0% |
[ 14.5% - 15.0% ] 14.63% | 875 | 35.7% |
[ 16.0% - 16.5% ] 16.23% | 573 | 4.5% |
[ 36.5% - 37.0% ] 36.57% | 216 | 100.0% |