Scottish Disability Age Under 5
COMPARE
Scottish
Select to Compare
Disability Age Under 5
Scottish Disability Age Under 5
1.6%
DISABILITY | AGE UNDER 5
0.0/ 100
METRIC RATING
307th/ 347
METRIC RANK
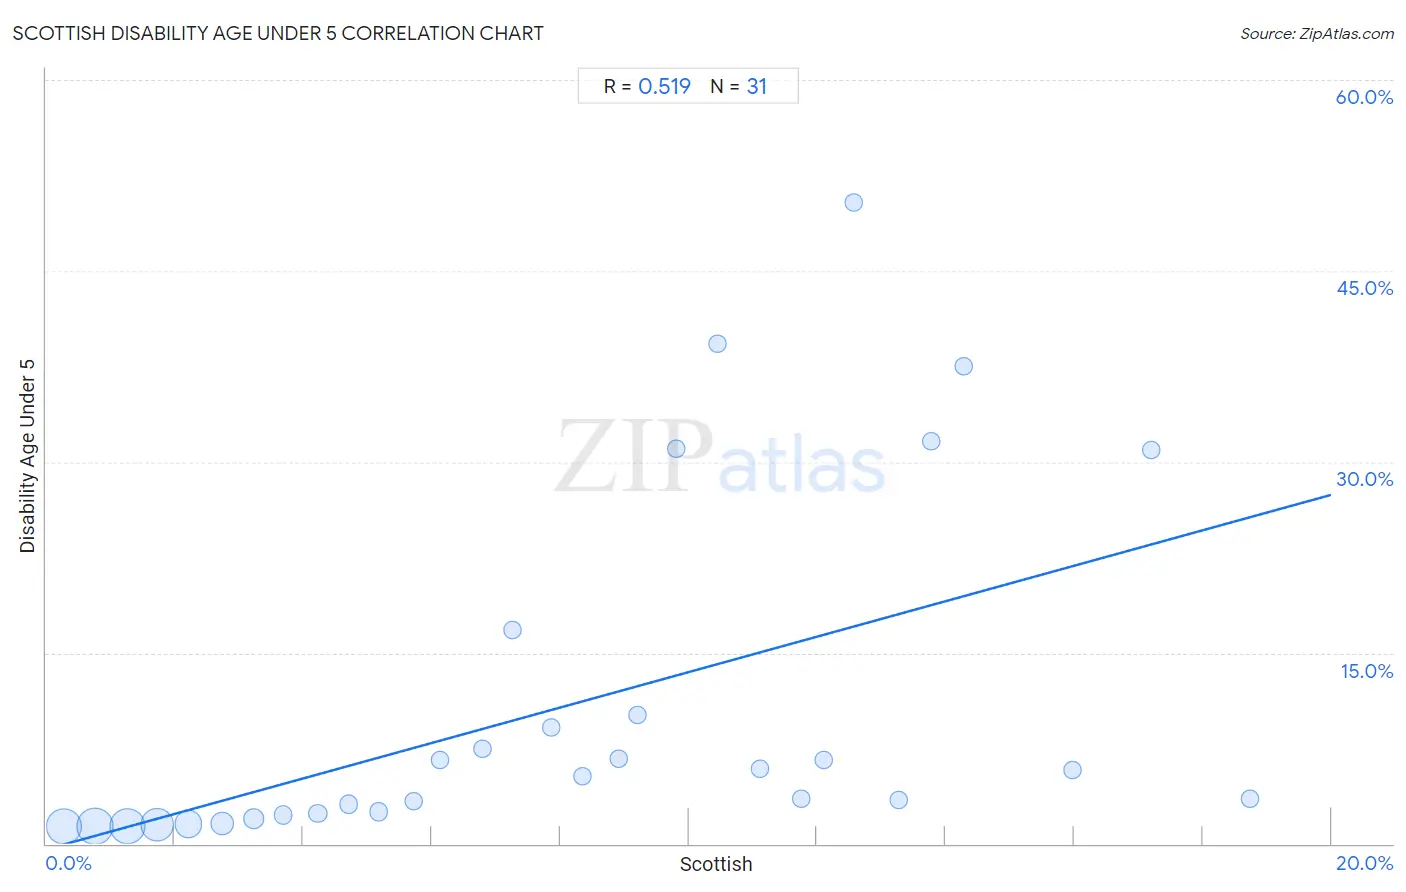
Scottish Disability Age Under 5 Correlation Chart
The statistical analysis conducted on geographies consisting of 258,599,259 people shows a substantial positive correlation between the proportion of Scottish and percentage of population with a disability under the age of 5 in the United States with a correlation coefficient (R) of 0.519 and weighted average of 1.6%. On average, for every 1% (one percent) increase in Scottish within a typical geography, there is an increase of 1.4% in percentage of population with a disability under the age of 5.
It is essential to understand that the correlation between the percentage of Scottish and percentage of population with a disability under the age of 5 does not imply a direct cause-and-effect relationship. It remains uncertain whether the presence of Scottish influences an upward or downward trend in the level of percentage of population with a disability under the age of 5 within an area, or if Scottish simply ended up residing in those areas with higher or lower levels of percentage of population with a disability under the age of 5 due to other factors.
Demographics Similar to Scottish by Disability Age Under 5
In terms of disability age under 5, the demographic groups most similar to Scottish are Creek (1.6%, a difference of 0.070%), Blackfeet (1.6%, a difference of 0.10%), Navajo (1.6%, a difference of 0.14%), Seminole (1.6%, a difference of 0.26%), and Cape Verdean (1.7%, a difference of 0.77%).
| Demographics | Rating | Rank | Disability Age Under 5 |
| Shoshone | 0.0 /100 | #300 | Tragic 1.6% |
| German Russians | 0.0 /100 | #301 | Tragic 1.6% |
| Welsh | 0.0 /100 | #302 | Tragic 1.6% |
| Swiss | 0.0 /100 | #303 | Tragic 1.6% |
| Seminole | 0.0 /100 | #304 | Tragic 1.6% |
| Blackfeet | 0.0 /100 | #305 | Tragic 1.6% |
| Creek | 0.0 /100 | #306 | Tragic 1.6% |
| Scottish | 0.0 /100 | #307 | Tragic 1.6% |
| Navajo | 0.0 /100 | #308 | Tragic 1.6% |
| Cape Verdeans | 0.0 /100 | #309 | Tragic 1.7% |
| Whites/Caucasians | 0.0 /100 | #310 | Tragic 1.7% |
| English | 0.0 /100 | #311 | Tragic 1.7% |
| Puerto Ricans | 0.0 /100 | #312 | Tragic 1.7% |
| Celtics | 0.0 /100 | #313 | Tragic 1.7% |
| Norwegians | 0.0 /100 | #314 | Tragic 1.7% |
Scottish Disability Age Under 5 Correlation Summary
| Measurement | Scottish Data | Disability Age Under 5 Data |
| Minimum | 0.28% | 1.4% |
| Maximum | 18.7% | 50.4% |
| Range | 18.5% | 49.0% |
| Mean | 8.1% | 10.8% |
| Median | 7.9% | 5.3% |
| Interquartile 25% (IQ1) | 3.7% | 2.3% |
| Interquartile 75% (IQ3) | 12.1% | 10.1% |
| Interquartile Range (IQR) | 8.4% | 7.8% |
| Standard Deviation (Sample) | 5.1% | 13.7% |
| Standard Deviation (Population) | 5.0% | 13.4% |
Correlation Details
| Scottish Percentile | Sample Size | Disability Age Under 5 |
[ 0.0% - 0.5% ] 0.28% | 49,771,048 | 1.4% |
[ 0.5% - 1.0% ] 0.76% | 54,383,686 | 1.4% |
[ 1.0% - 1.5% ] 1.26% | 50,956,439 | 1.4% |
[ 1.5% - 2.0% ] 1.72% | 45,223,039 | 1.5% |
[ 2.0% - 2.5% ] 2.22% | 27,604,438 | 1.6% |
[ 2.5% - 3.0% ] 2.74% | 16,160,058 | 1.6% |
[ 3.0% - 3.5% ] 3.24% | 7,284,801 | 2.0% |
[ 3.5% - 4.0% ] 3.69% | 3,576,923 | 2.3% |
[ 4.0% - 4.5% ] 4.23% | 1,809,785 | 2.4% |
[ 4.5% - 5.0% ] 4.71% | 688,438 | 3.1% |
[ 5.0% - 5.5% ] 5.18% | 575,229 | 2.5% |
[ 5.5% - 6.0% ] 5.72% | 273,464 | 3.3% |
[ 6.0% - 6.5% ] 6.13% | 92,876 | 6.6% |
[ 6.5% - 7.0% ] 6.79% | 51,988 | 7.5% |
[ 7.0% - 7.5% ] 7.27% | 10,790 | 16.8% |
[ 7.5% - 8.0% ] 7.86% | 33,034 | 9.1% |
[ 8.0% - 8.5% ] 8.34% | 46,283 | 5.3% |
[ 8.5% - 9.0% ] 8.91% | 15,573 | 6.7% |
[ 9.0% - 9.5% ] 9.21% | 8,449 | 10.1% |
[ 9.5% - 10.0% ] 9.80% | 2,521 | 31.1% |
[ 10.0% - 10.5% ] 10.45% | 2,392 | 39.3% |
[ 11.0% - 11.5% ] 11.10% | 8,304 | 5.9% |
[ 11.5% - 12.0% ] 11.75% | 2,801 | 3.6% |
[ 12.0% - 12.5% ] 12.10% | 7,619 | 6.6% |
[ 12.5% - 13.0% ] 12.56% | 995 | 50.4% |
[ 13.0% - 13.5% ] 13.27% | 663 | 3.4% |
[ 13.5% - 14.0% ] 13.78% | 617 | 31.6% |
[ 14.0% - 14.5% ] 14.29% | 105 | 37.5% |
[ 15.5% - 16.0% ] 15.97% | 1,547 | 5.8% |
[ 17.0% - 17.5% ] 17.19% | 861 | 30.9% |
[ 18.5% - 19.0% ] 18.74% | 4,493 | 3.6% |